Residential Retrofits Achieve Net-Zero Energy


Once the options were selected, the energy simulation engine was able to compare all the different combinations of options to generate a trade-off curve. The trade-off curve shows the energy savings (x-axis below) and AERC (y-axis below) related to any single combination of options chosen, and enables the user to identify the best solution. The accompanying graph shows the trade-off curve. Each point in the graph represents a different combination of building parameters and their associated investment and AERC.
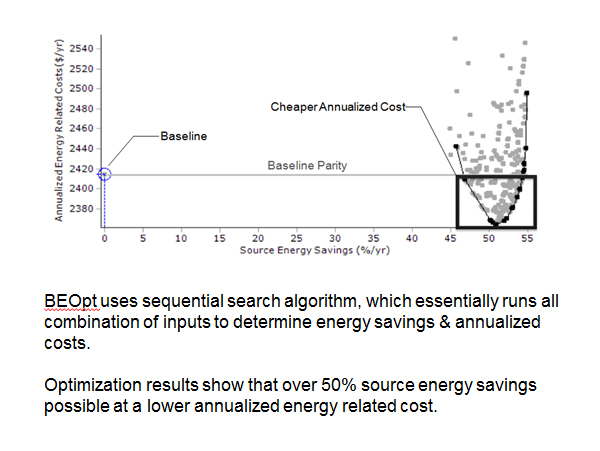
Note the point on the left side of the graph—it represents the baseline configuration. Therefore, the AERC reported in this case does not account for any loan costs, which are only required for retrofit work. For the retrofit solution, however, the AERC also includes the initial capital cost (principle + interest) related to the retrofit solution annualized over a time period of 30 years. It is important to note that most of the retrofit solutions result in an AERC lower than the baseline solution, such suggests that the baseline home is a prime candidate for a deep energy retrofit.
The curve created by the points in black represents the optimization front (or trade off curve). The source energy savings that can be obtained are in the range of 45 percent to 55 percent, but the optimum solution—the highest source energy savings for the lowest cost—is obtained with AERC of $2,360 a year, and source energy savings of above 50 percent. In other words, optimization results for the ReNEWW house showed that the retrofit solution with the lowest annualized energy-related cost results in source energy savings of more than 50 percent, under the assumptions used in BEOpt.
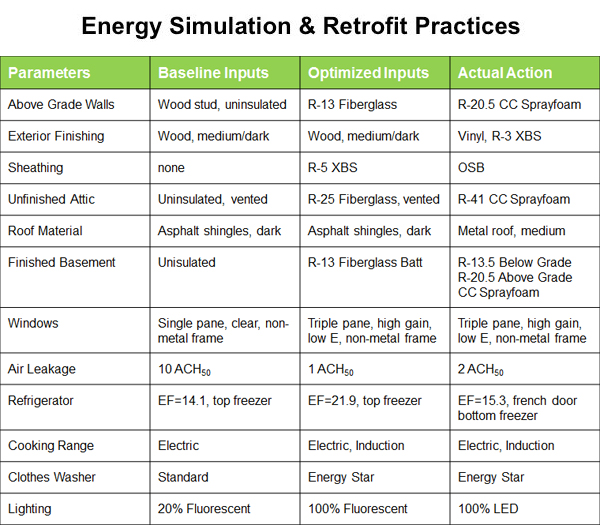
The results of the energy simulation were used to inform actual retrofit actions for the ReNEWW House that were implemented during the summer of 2014, notably installing triple pane windows, insulating to R-13 below grade, upgrading all the appliances, and replacing all the lighting with LED. The table below presents a comparison between what the simulation recommended as optimal and what was actually implemented in the retrofit. Most importantly, the energy simulation can predict the post energy retrofit consumption of the house, which in turn, can provide important information on sizing the solar energy system that will be required to achieve net-zero energy.
Retrofit Savings
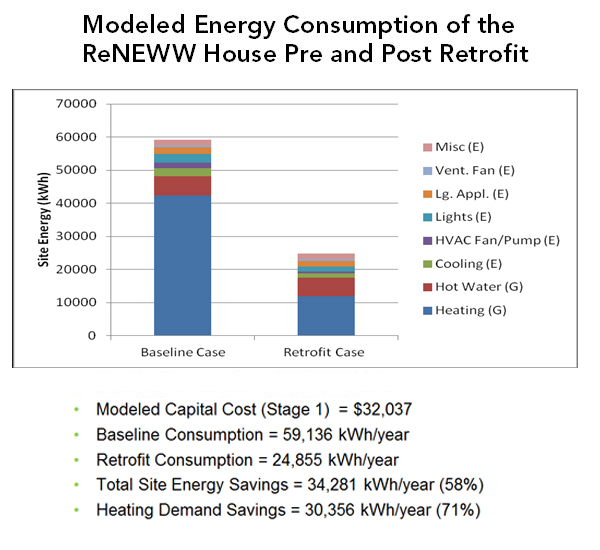
The total capital cost of the optimum solution according to the assumptions considered by the BEOpt is $32,037, which enables the household energy consumption to be reduced by 50 percent. Cost data was obtained from the National Renewable Energy Laboratory's Retrofit Cost Database. The accompanying figure shows the modeled energy consumption of the ReNEWW House both before and after the retrofit in kWh. As can be seen, the total site energy consumption of the house decreased from 59,136 kWh/year to 24,855 kWh/year for a total energy saving of 34,281 kWh/year, a 58 percent savings. As expected, the largest reduction was in the heating demand, which dropped from 42,322 kWh/year to 24,855 kWh/year, a consequent energy savings of 30,356 kWh/year, or a 71 percent savings.
Notice