This CE Center article is no longer eligible for receiving credits.
The Product Level: Wood Environmental Product Declarations and What They Can Tell Us
The ability to assess the environmental impact of a building ultimately rests on the life-cycle information for each component material. Sometimes consumers just want this information available at the product level.
An EPD is a standardized, third-party-verified label that communicates the environmental performance of a product. Data for an EPD is based on an LCA report, third-party verified for conformance to a specific set of product category rules (PCR). The comparison of material specific EPDs that are based on different PCRs is not readily achievable and requires considerable expertise in LCA. An EPD includes information about both product attributes and production impacts, and it provides information to industrial customers and end-use consumers regarding environmental impacts. The nature of EPDs also allows summation of environmental impacts along a product’s supply chain—a powerful feature that greatly enhances the utility of LCA-based information.
ISO 21930, the ISO standard that sets out core rules for environmental product declarations of construction products and services, separates the stages of construction into five modules: production, construction, use, end-of-life, and optional supplementary beyond the system boundary, as shown in Figure 1.
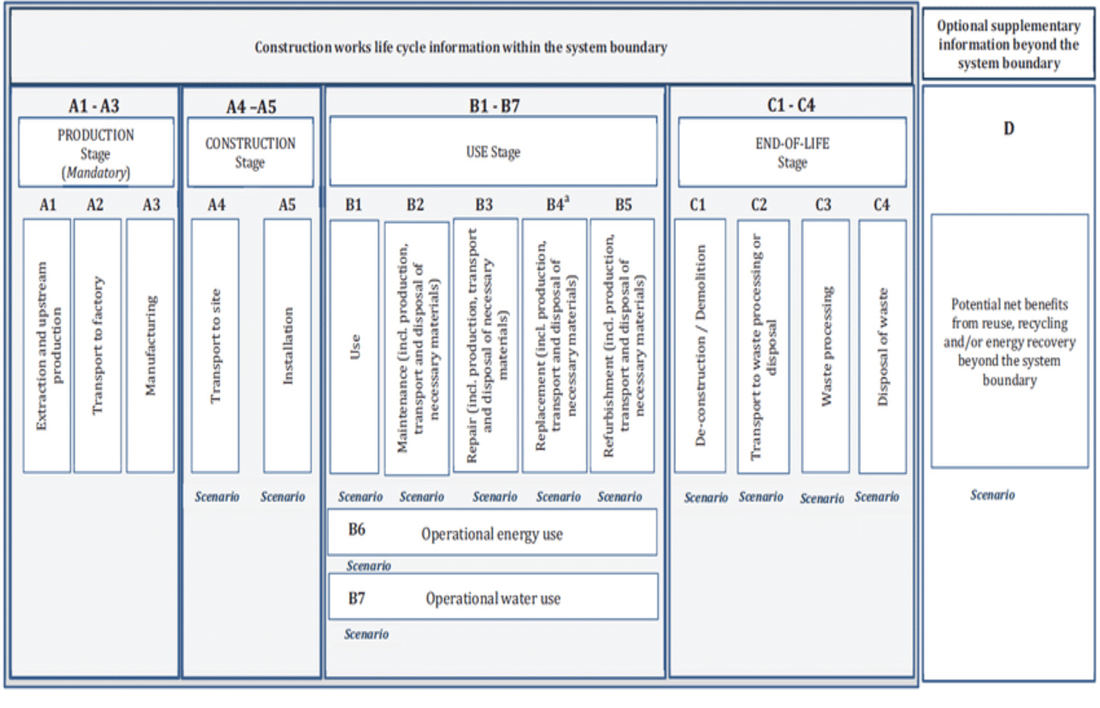
Figure 1: Building material life-cycle information (stages and modules) with the system boundary.12
Wood EPDs are underpinned by the biogenic carbon cycle—in product storage, energy for manufacturing, and impacts in the forest. A cycle, by its very nature, is not linear and not as well suited for life-cycle assessment methodology, which mathematically is a mass-balance equation underpinned by linear algebra. The complexity of the biogenic cycle warrants detailed explanation.
Difference between Biogenic and Fossil Carbon
As trees grow, they clean the air we breathe by absorbing CO2 from the atmosphere. Trees release the oxygen (O2) and incorporate the carbon (C) into their twigs, stems, roots, leaves or needles, and surrounding soil. Young, vigorously growing trees take up CO2 quickly, with the rate slowing as they reach maturity (typically 60-100 years, depending on species and environmental factors). A single tree can absorb as much as 48 pounds of CO2 per year and sequester up to 1 ton of CO2 by the time it reaches 40 years old.13 As trees mature and then die, they start to decay and slowly release the stored carbon back into the atmosphere.
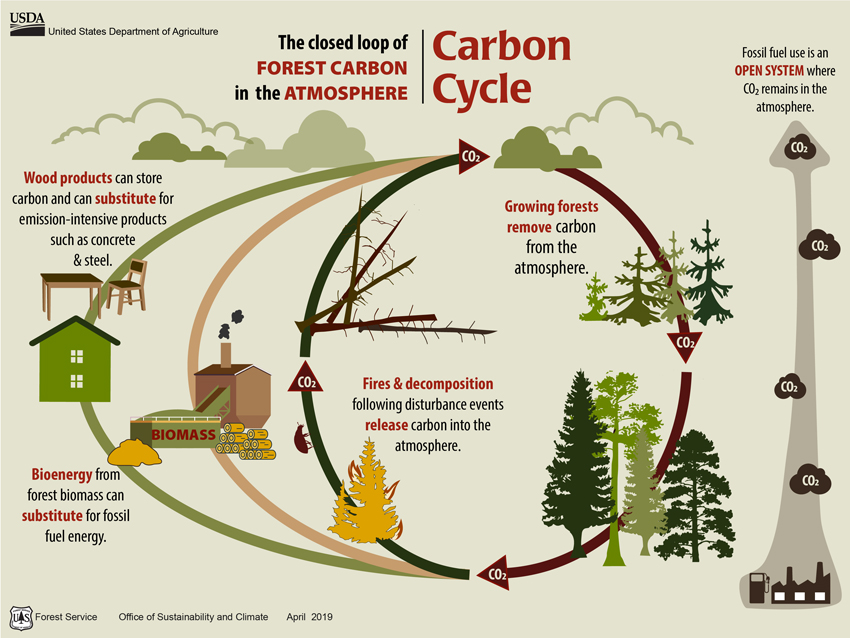
Figure 2: The closed-loop cycle of forest carbon in the atmosphere versus the open/one-way system of fossil fuel.14
Carbon can also be released back to the atmosphere, but more quickly, when forests succumb to natural hazards such as wildfire, insects, or disease. Growing forests absorb, store, and release carbon over extended periods of time. This cycle is a closed-loop cycle through natural processes of growth, decay, and disturbances. It is also a closed-loop cycle when forests are harvested for use in products or energy as shown in Figure 2. The biogenic carbon cycle fundamentally differs from the open/one-way flow of fossil carbon to the atmosphere. Whether trees are harvested and used for products or decay naturally, the cycle is ongoing, as forests regenerate and young trees once again begin absorbing carbon. However, when trees are manufactured into products and used in buildings, a new phase of carbon mitigation begins and some carbon is never returned to the atmosphere.
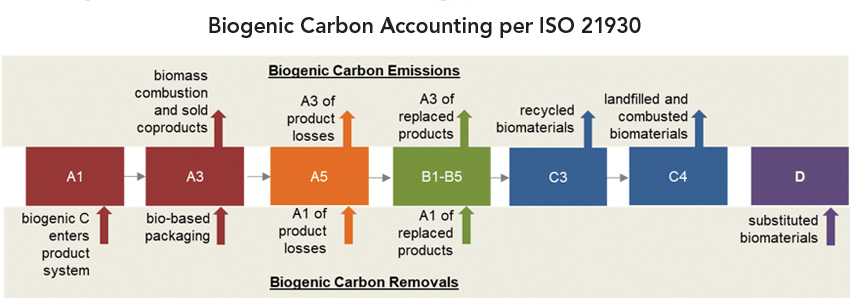
Figure 3: Biogenic removals (inputs) and emissions (outputs) in North American Wood Product EPDs.15
Explanation of How Biogenic Carbon Is Addressed in ISO 21930 and Wood Product EPDs
North American Wood Product EPDs follow guidance from ISO 21930 to account for biogenic carbon. Section 7.2.11 requires confirmation either a) that that country of wood origin’s net carbon stocks are stable or increasing, or b) the fiber comes from a certified forest (see next section). In the EPD, biogenic carbon then enters the product system as sequestered carbon (denoted as a removal), and its emissions are tracked and reported in the stages where they occur (see Figure 3).
If the EPD is a cradle-to-gate EPD, the emissions associated with end-of-life are also included, creating a zero balance; hence the long-term carbon storage associated with the harvested wood product can only be included in a cradle-to-grave EPD. Many wood product EPDs, however, estimate the long-term storage using USFS methodology and report in the “additional information section.”
In 2020 the American Wood Council and Canadian Wood Council published updated cradle-to-gate EPDs for six of the major North American wood products (softwood lumber, plywood, OSB, laminated veneer lumber, I-joists, and glued laminated timber), replacing the 2013 versions (www.awc.org/sustainability/epd). The primary data used to develop these EPDs are based on mill surveys for each product category. These were used to develop life-cycle assessments, which is the data used to create the EPD. A 2018 Special Issue of The Forest Products Journal compiled these LCAs, which can be found on the Consortium for Research on Renewable Industrial Material (CORRIM’s) website (corrim.org/fpj-special-issue).
EPDs are best able to assess environmental impacts associated with the stages outlined above. Assessment of landscape management impacts on the other things we care about, like biodiversity, water quality, and overall sustainability, are best captured through complementary assurances, such as sustainable forestry certification.
Other Forest Sustainability Assurances
Forest Certification
Forest certification assesses a landowner’s forest management against a series of agreed standards related to water quality, biodiversity, wildlife, and forests with exceptional conservation value. Wood is one of the few building materials that has third-party certification programs in place to demonstrate that products being sold have come from a responsibly managed resource. As of 2020, more than 600 million acres of forest in the United States and Canada were certified under one of the four internationally recognized programs used in North America.17 About 47 percent of forests in Canada are certified and 19 percent in the United States, both above the global average of 11 percent.18
The four primary systems in North America, Sustainable Forestry Initiative (SFI), Forest Stewardship Council (FSC), Canadian Standards Association (CSA), and American Tree Farm System (ATFS), all have slightly different principles and procedures. SFI is a single-standard North American program. FSC is a global program with regional standards. CSA is the Canadian National Forest Management Standard, and ATFS is geared toward smaller U.S. landowners.
Given the cost of third-party verification, wide-scale certification is not feasible for the small family landowners that make up the largest percentage of land ownership in the United States (almost 290 million acres). U.S. federal timberlands are not certified, but this does not mean they are not being sustainably managed. In 2007, the Pinchot Institute conducted a study of five national forests and found their management practices met many of the certification requirements in terms of forest planning, protection of threatened and endangered species, and others.19
Another type of certification aimed at the mills, fiber sourcing certification, focuses on assurances that can be made in the supply chain. There are three major responsible fiber sourcing standards in North America (see sidebar on previous page).
In addition, every U.S. state has developed best management practices (BMPs) guidelines for water quality and other environmental concerns such as soil erosion and regeneration. Some of these are codified into state forest practice regulation and others are voluntary. Water quality BMPs, whether regulatory, quasi-regulatory, or non-regulatory, are tracked in the United States and achieve above 90 percent compliance in all states.20 This is important because roughly 60 percent of drinking water is sourced from forests across the nation, up to 75 percent in the U.S. West.21
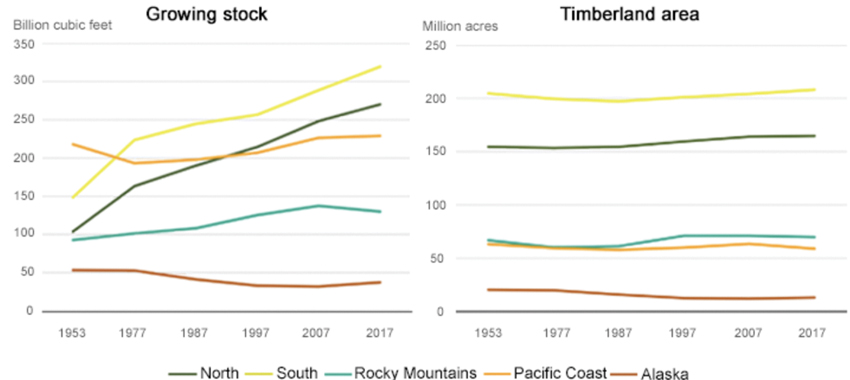
Figure 4: Forest Inventory (billion cubic feet) by region 1953–2017 as well as acres of timberland.
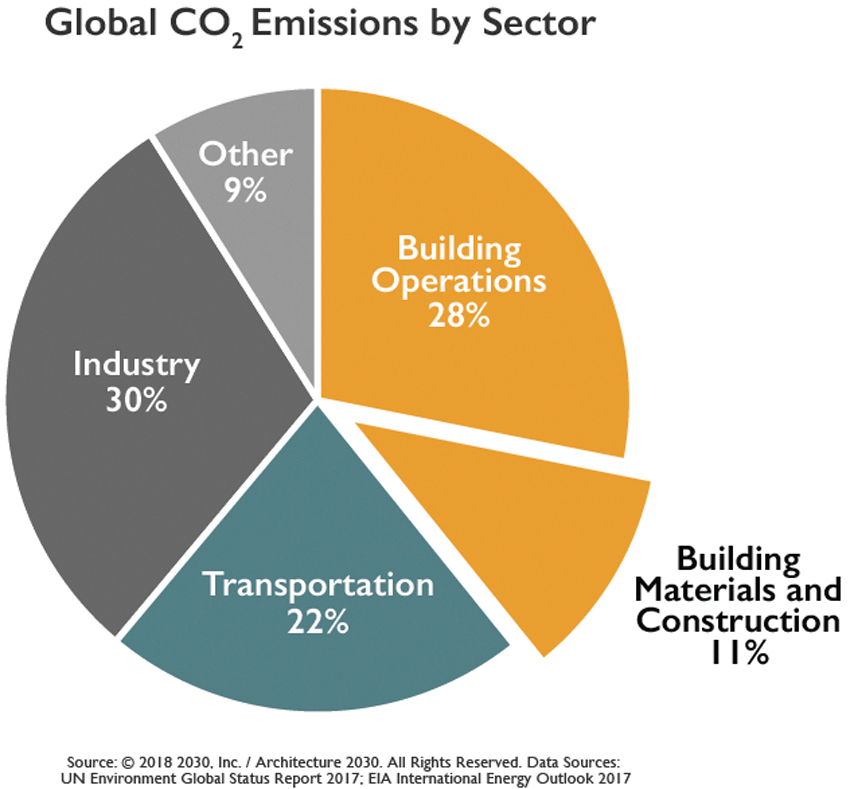
From an environmental perspective, it is widely known that buildings matter. Buildings consume nearly half the energy produced in the United States, use three-quarters of the electricity, and account for nearly half of all carbon dioxide (CO2) emissions.1 The magnitude of their impacts is the driving force behind many initiatives to improve tomorrow’s structures—from energy regulations and government procurement policies, to green building rating systems and programs such as the Architecture 2030 Challenge. The focus on energy efficiency, in particular, has led to widespread improvements, so much so that many designers are now giving greater attention to the impacts of structural building materials. This greater attention has revealed that greenhouse gas (GHG) emissions associated with materials used in buildings and construction account for 28 percent of building sector emissions and 11 percent of global GHG emissions.2
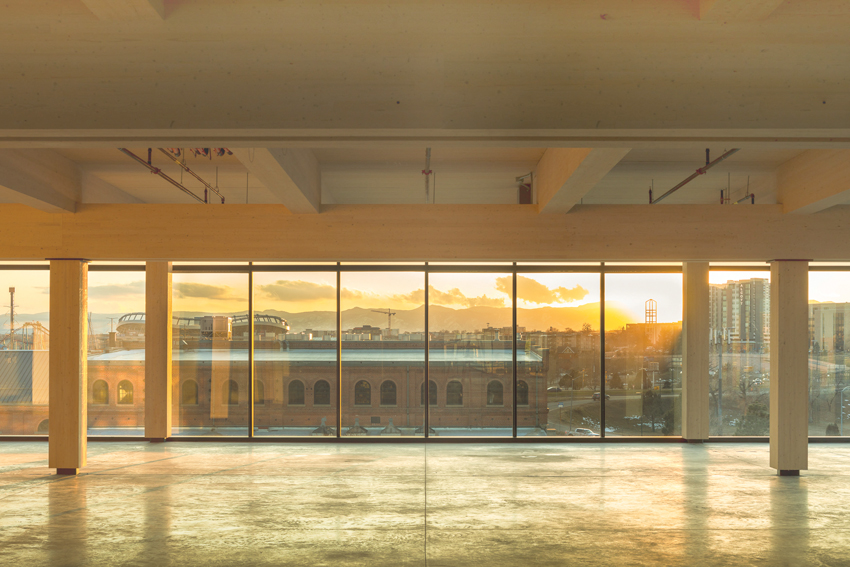
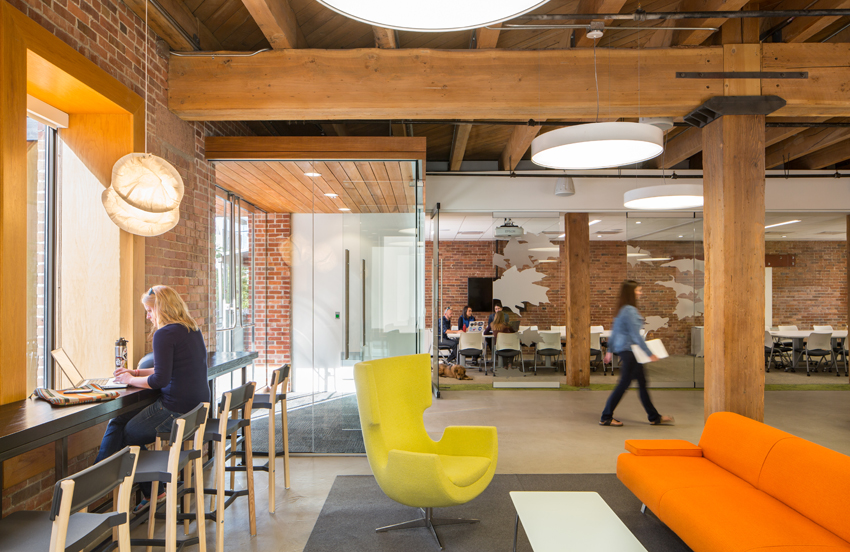
Photo: © Oz Architecture/JC Buck; courtesy of WoodWorks
Located in downtown Denver, Platte Fifteen is a five-story workspace that incorporates a mass-timber frame built using glue-laminated timber (glulam) beams and columns as well as cross-laminated timber (CLT) floor and roof panels.
Are we able to dive deeper into these numbers to find ways to reduce a building’s carbon footprint in meaningful ways? What are the methods used to measure building material carbon footprint and do they tell the whole story? Are there simple tools to assess material choices? This course seeks to address these and other questions by explaining the principal methods and tools that are used to assess carbon footprint in the context of building materials. It includes a primer on product terminology, including life-cycle assessment (LCA), environmental product declarations (EPDs), carbon footprint, embodied carbon, and whole-building LCA (WBLCA) tools. It explains how biogenic carbon is treated in standard LCA methodology and dives into the forest side of the equation, explaining basics of the sustainable forestry cycle. This course also highlights some ways to track and assure wood comes from sustainable forests in North America and why demand for wood products supports investment in forest management.
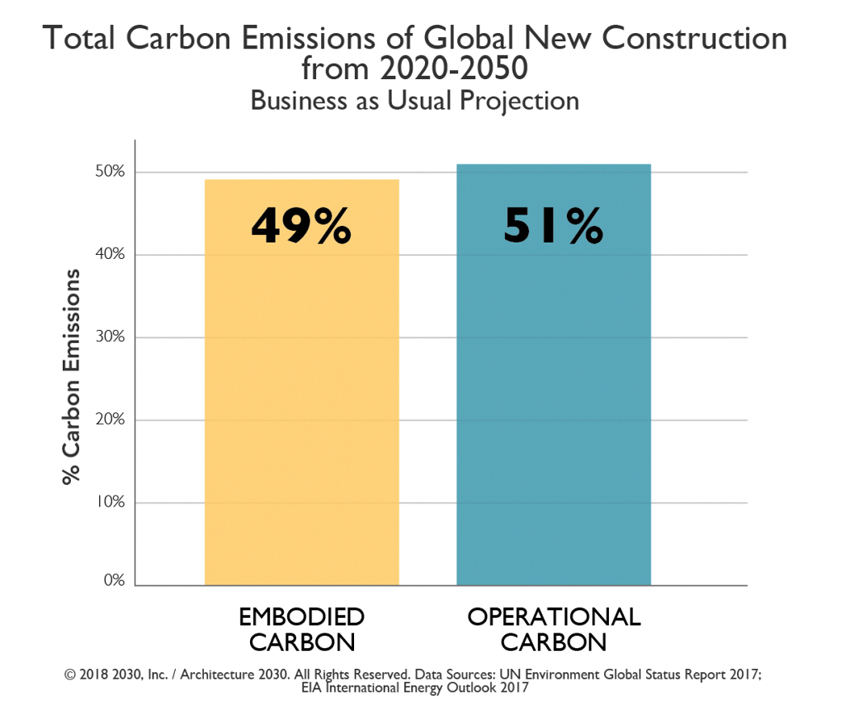
Source: © 2018 2030, Inc./Architecture 2030. All Rights Reserved. Data Sources: UN Environment Global Status Report 2017; EIA International Energy Outlook 2017. www.architecture2030.org
Source: © 2018 2030, Inc./Architecture 2030. All Rights Reserved. Date Sources: UN Environment Global Status Report 2017; EIA International Energy Outlook 2017. www.architecture2030.org
Why Buildings Matter
The growing urgency to address climate change was underscored in a 2018 Special IPCC report warning that in order to allow time for the earth to adapt to a warming climate, carbon emissions need to be further reduced to be in line with a 1.5 degrees Celsius warming, not 2 degrees Celsius as originally discussed. They warned that a 2 degrees Celsius temperature rise could raise sea levels to such a height that another 10 million people would be at risk of flooding. To stay within 1.5 degrees Celsius warming, global GHG emissions need to decline 45 percent below 2010 levels by 2030 and reach net-zero emissions by 2050.
The building sector has a critical role to play in what happens over the next 30 years. Not only do buildings account for almost 40 percent of global GHG emissions, but the increasing urbanization of the population means that 2.48 trillion square feet of building is expected to be added to the global building stock by 2060. This number is essentially double the current building stock, making the choice of materials in buildings over the next decades that much more important.
Architects and engineers are setting aggressive goals to help reduce emissions. Architecture 2030 has issued the following challenge to the global architecture and building community for embodied carbon: “The embodied carbon emissions from all buildings, infrastructure, and associated materials shall immediately meet a maximum global warming potential (GWP) of 40 percent below the industry average today. The GWP reduction shall be increased to: 45 percent or better in 2025; 65 percent of better in 2030; zero GWP by 2040.”3 The 2030 Challenge is widely adopted in the United States and globally by individuals, professional organizations, and governments. It has been adopted into federal, state, and local government legislation and has become standard practice in many AEC firms. It advances the use of low-carbon/carbon-sequestering materials, building materials with high-impact potential for emissions reductions, and whole-building approaches to emissions reductions.
Similarly, the structural engineering community has set the SE2050 goal to promote, design, and construct net-zero embodied carbon structures by 2050 (se2050.org). “Signing up to the SE 2050 Commitment Program requires creating a firm-wide plan to reduce the embodied carbon of your structural systems, tracking your progress, and evaluating and reducing the embodied carbon impacts of the design decisions you make on your projects.”
Carbon Footprint in the Context of Building Materials: A Primer on the Terms
Understanding a material’s impact at every stage of its life is essential for designers looking to compare alternate designs or simply make informed choices about the products they use. Life-cycle assessment (LCA) is an internationally recognized method for measuring the environmental impacts of materials, assemblies, or whole buildings from extraction or harvest of raw materials through manufacturing, transportation, installation, use, maintenance, and disposal or recycling.
An LCA is sometimes described as cryptic and complicated. Yet, what is involved is simply a thorough accounting of resource consumption, including energy, emissions, and wastes associated with production and use of a product. For a “product” as complex as a building, this means tracking and tallying inputs and outputs for all assemblies and subassemblies—every framing member, panel, fastener, finish material, coating, and so on. To ensure that results and data developed by different LCA practitioners and in different countries are consistent, LCA practitioners must adhere to a set of international guidelines set forth by the International Organization for Standardization (ISO).
An LCA assesses many different environmental impacts, but the one that many builders and architects are interested in from a climate perspective is carbon footprint. A building carbon footprint includes both operation emissions and the emissions associated with producing the material. A building material carbon footprint is often referred to as “embodied carbon.” Note that embodied carbon refers to the emissions associated with manufacturing a product, not the carbon that is physically stored in the wood product itself.
One of the reasons wood tends to have lower embodied carbon is that it requires far less energy to manufacture than other materials4—and very little fossil-fuel energy, since most of the energy used comes from converting residual bark and sawdust to electrical and thermal energy. For example, the production of steel, cement, and glass requires temperatures of up to 3,500 degrees Fahrenheit, which is achieved with large amounts of fossil-fuel energy. Member companies of the American Wood Council, on average, rely on residual bark and wood biomass for more than 75 percent of their energy needs.5
Comparison of Wood Carbon Footprint
Embodied carbon of different materials can be compared if they have the same functional equivalency, which means they provide the same service for the same length of time. The difference between these two values is referred to as the substitution benefit, meaning the avoided emissions achieved by using the lower embodied carbon material instead of the higher embodied carbon material. LCA studies consistently demonstrate wood’s substitution benefits. For example, one literature review analyzed 51 studies, which provided information on 433 substitution factors. “The large majority of studies indicate that the use of wood and wood-based products are associated with lower fossil- and process-based emissions when compared to non-wood products. Overall, the 51 reviewed studies suggest an average substitution effect of 1.2 kg C/kg C, which means that for each kilogram of C in wood products that substitute non-wood products, there occurs an average emission reduction of approximately 1.2 kg C.”6 The study further finds that when just looking at comparisons in the construction sector there is a substitution factor of 1.3 kg C/kg C wood product, which converts to 4.76 kg CO2 equivalent (CO2e)/kg C in wood.
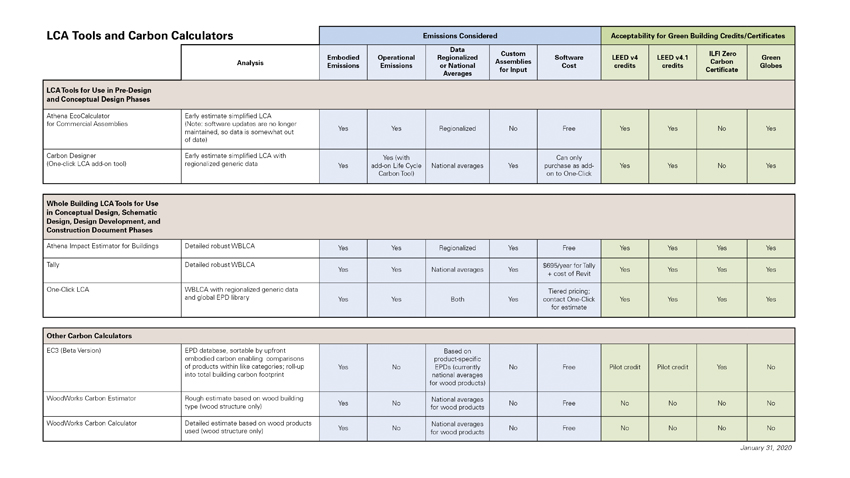
Whole-Building LCA (WBLCA) tools
Architects and engineers can use whole-building LCA tools to help evaluate environmental impacts of building designs. These tools use life-cycle inventory data to readily assess material choices. For example, the Athena Impact Estimator for Buildings (calculatelca.com/software/impact-estimator) gives users access to life-cycle data without requiring advanced skills. Athena does not rely on EPDs, but has built its own database. All Athena tools comply with LCA methodology standards developed by ISO 14040 and 14044 series. The Impact Estimator and EcoCalculator use data from Athena’s own datasets and from the U.S. Life Cycle Inventory Database.
It can model more than 1,200 structural and envelope assembly combinations, allowing for quick and easy comparison of design options. Results can be summarized by assembly group and life-cycle stage. Users input basic information about building geography, size, and height. A building model is developed by creating a series of assemblies, such as walls, floors, and roofs. Materials in these assemblies can be altered to determine relative impact on total building impacts. Alternatively, users can import a bill of materials from any CAD program. These materials create a life-cycle inventory and are assessed using the TRACI (Tool for the Reduction and Assessment of Chemical and Other Environmental Impacts) methodology9 to create a life-cycle impact assessment, with final reporting on GHG-related impacts including global warming potential, acidification potential, human health particulate, ozone depletion potential, smog potential, and eutrophication (harmful nutrient runoff) potential.10
Other commercial license tools, such as Tally (choosetally.com) and Oneclick (www.oneclicklca.com) integrate architect and engineer software, such as Revit, to assess environmental impacts of building material lists. Tally pulls its material life-cycle inventory information from GaBi, an international life-cycle inventory database, and One-Click relies on published EPDs, which some experts warn may be not well suited for whole-building LCAs due to inconsistencies across product categories.
WBLCA tools can help architects and engineers make material design choices to reduce the environmental impacts of buildings. These can be assessed at the individual system level (e.g., flooring, wall) or entire buildings. WBLCA tools are also acceptable in many green building certification programs, including LEED and Green Globes.
Other tools may be helpful after a building has been designed. The Embodied Carbon in Construction Calculator (EC3) (www.buildingtransparency.org/en) will facilitate the comparison of product EPDs within the same material categories. It is currently in beta form, and work is being done to properly characterize wood EPDs.
The Carbon Calculator for Wood Buildings (cc.woodworks.org) focuses on the volume of structural wood in a building and estimates how much carbon is stored in the wood, the greenhouse gas emissions avoided by not using steel or concrete, and the amount of time it takes North American forests to grow that volume of wood. It does this in one of two ways:
- If the volume of wood products is known (including lumber, panels, engineered wood, decking, siding, and roofing), the carbon calculator will provide a detailed estimate for that specific building. The more detailed the information, the better the results.
- If volume information is unknown, users can select from a list of common building types and receive an estimate based on typical wood use.
For the more detailed calculation, users enter the nominal volume of wood in a building, and the calculator then performs necessary volume conversions, makes corrections for moisture content, and arrives at a total mass figure of wood contained in the building. The tool then uses that information to estimate the building’s carbon benefits.
No one material is the best choice for every application. There are tradeoffs associated with each, and each has benefits that could outweigh the other material choices based on a project’s design objectives. In some cases, a hybrid structural approach can be the best option.
The Product Level: Wood Environmental Product Declarations and What They Can Tell Us
The ability to assess the environmental impact of a building ultimately rests on the life-cycle information for each component material. Sometimes consumers just want this information available at the product level.
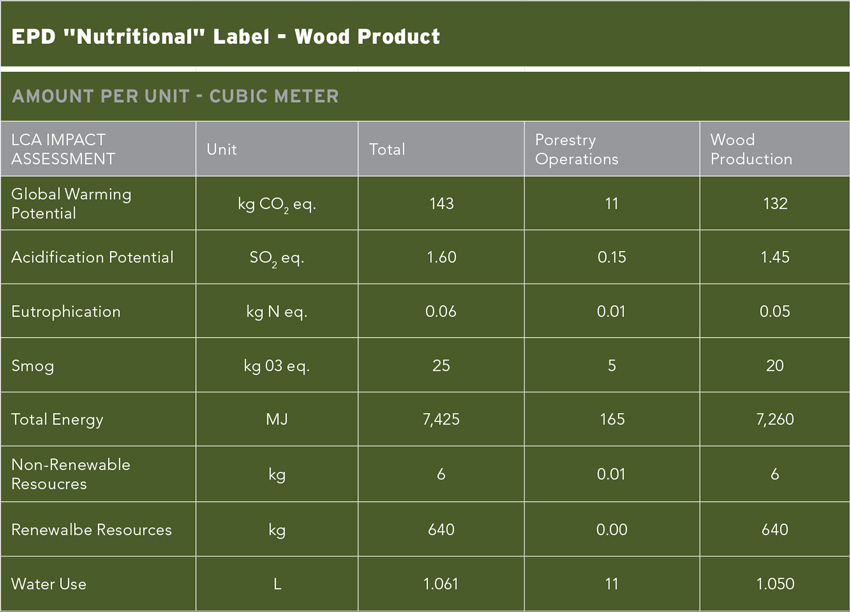
An EPD is a standardized, third-party-verified label that communicates the environmental performance of a product. Data for an EPD is based on an LCA report, third-party verified for conformance to a specific set of product category rules (PCR). The comparison of material specific EPDs that are based on different PCRs is not readily achievable and requires considerable expertise in LCA. An EPD includes information about both product attributes and production impacts, and it provides information to industrial customers and end-use consumers regarding environmental impacts. The nature of EPDs also allows summation of environmental impacts along a product’s supply chain—a powerful feature that greatly enhances the utility of LCA-based information.
ISO 21930, the ISO standard that sets out core rules for environmental product declarations of construction products and services, separates the stages of construction into five modules: production, construction, use, end-of-life, and optional supplementary beyond the system boundary, as shown in Figure 1.
Figure 1: Building material life-cycle information (stages and modules) with the system boundary.12
Wood EPDs are underpinned by the biogenic carbon cycle—in product storage, energy for manufacturing, and impacts in the forest. A cycle, by its very nature, is not linear and not as well suited for life-cycle assessment methodology, which mathematically is a mass-balance equation underpinned by linear algebra. The complexity of the biogenic cycle warrants detailed explanation.
Difference between Biogenic and Fossil Carbon
As trees grow, they clean the air we breathe by absorbing CO2 from the atmosphere. Trees release the oxygen (O2) and incorporate the carbon (C) into their twigs, stems, roots, leaves or needles, and surrounding soil. Young, vigorously growing trees take up CO2 quickly, with the rate slowing as they reach maturity (typically 60-100 years, depending on species and environmental factors). A single tree can absorb as much as 48 pounds of CO2 per year and sequester up to 1 ton of CO2 by the time it reaches 40 years old.13 As trees mature and then die, they start to decay and slowly release the stored carbon back into the atmosphere.
Figure 2: The closed-loop cycle of forest carbon in the atmosphere versus the open/one-way system of fossil fuel.14
Carbon can also be released back to the atmosphere, but more quickly, when forests succumb to natural hazards such as wildfire, insects, or disease. Growing forests absorb, store, and release carbon over extended periods of time. This cycle is a closed-loop cycle through natural processes of growth, decay, and disturbances. It is also a closed-loop cycle when forests are harvested for use in products or energy as shown in Figure 2. The biogenic carbon cycle fundamentally differs from the open/one-way flow of fossil carbon to the atmosphere. Whether trees are harvested and used for products or decay naturally, the cycle is ongoing, as forests regenerate and young trees once again begin absorbing carbon. However, when trees are manufactured into products and used in buildings, a new phase of carbon mitigation begins and some carbon is never returned to the atmosphere.
Figure 3: Biogenic removals (inputs) and emissions (outputs) in North American Wood Product EPDs.15
Explanation of How Biogenic Carbon Is Addressed in ISO 21930 and Wood Product EPDs
North American Wood Product EPDs follow guidance from ISO 21930 to account for biogenic carbon. Section 7.2.11 requires confirmation either a) that that country of wood origin’s net carbon stocks are stable or increasing, or b) the fiber comes from a certified forest (see next section). In the EPD, biogenic carbon then enters the product system as sequestered carbon (denoted as a removal), and its emissions are tracked and reported in the stages where they occur (see Figure 3).
If the EPD is a cradle-to-gate EPD, the emissions associated with end-of-life are also included, creating a zero balance; hence the long-term carbon storage associated with the harvested wood product can only be included in a cradle-to-grave EPD. Many wood product EPDs, however, estimate the long-term storage using USFS methodology and report in the “additional information section.”
In 2020 the American Wood Council and Canadian Wood Council published updated cradle-to-gate EPDs for six of the major North American wood products (softwood lumber, plywood, OSB, laminated veneer lumber, I-joists, and glued laminated timber), replacing the 2013 versions (www.awc.org/sustainability/epd). The primary data used to develop these EPDs are based on mill surveys for each product category. These were used to develop life-cycle assessments, which is the data used to create the EPD. A 2018 Special Issue of The Forest Products Journal compiled these LCAs, which can be found on the Consortium for Research on Renewable Industrial Material (CORRIM’s) website (corrim.org/fpj-special-issue).
EPDs are best able to assess environmental impacts associated with the stages outlined above. Assessment of landscape management impacts on the other things we care about, like biodiversity, water quality, and overall sustainability, are best captured through complementary assurances, such as sustainable forestry certification.
Other Forest Sustainability Assurances
Forest Certification
Forest certification assesses a landowner’s forest management against a series of agreed standards related to water quality, biodiversity, wildlife, and forests with exceptional conservation value. Wood is one of the few building materials that has third-party certification programs in place to demonstrate that products being sold have come from a responsibly managed resource. As of 2020, more than 600 million acres of forest in the United States and Canada were certified under one of the four internationally recognized programs used in North America.17 About 47 percent of forests in Canada are certified and 19 percent in the United States, both above the global average of 11 percent.18
The four primary systems in North America, Sustainable Forestry Initiative (SFI), Forest Stewardship Council (FSC), Canadian Standards Association (CSA), and American Tree Farm System (ATFS), all have slightly different principles and procedures. SFI is a single-standard North American program. FSC is a global program with regional standards. CSA is the Canadian National Forest Management Standard, and ATFS is geared toward smaller U.S. landowners.
Given the cost of third-party verification, wide-scale certification is not feasible for the small family landowners that make up the largest percentage of land ownership in the United States (almost 290 million acres). U.S. federal timberlands are not certified, but this does not mean they are not being sustainably managed. In 2007, the Pinchot Institute conducted a study of five national forests and found their management practices met many of the certification requirements in terms of forest planning, protection of threatened and endangered species, and others.19
Another type of certification aimed at the mills, fiber sourcing certification, focuses on assurances that can be made in the supply chain. There are three major responsible fiber sourcing standards in North America (see sidebar on previous page).
In addition, every U.S. state has developed best management practices (BMPs) guidelines for water quality and other environmental concerns such as soil erosion and regeneration. Some of these are codified into state forest practice regulation and others are voluntary. Water quality BMPs, whether regulatory, quasi-regulatory, or non-regulatory, are tracked in the United States and achieve above 90 percent compliance in all states.20 This is important because roughly 60 percent of drinking water is sourced from forests across the nation, up to 75 percent in the U.S. West.21
Figure 4: Forest Inventory (billion cubic feet) by region 1953–2017 as well as acres of timberland.
The Forest Side of the Equation
Responsibly managing forests in a way that balances harvesting and replanting, and provides a sustainable source of wood products that continue to store carbon and offset the use of fossil fuels, can significantly reduce the amount of carbon in the atmosphere over the long term.
The U.S. Forest Service (USFS) keeps track of the volume and health of U.S. forests by measuring permanent plots scattered across the country through its Forest Inventory Analysis (FIA) program (www.fia.fs.fed.us). These measurements are rolled up into the national GHG inventory that is reported to the IPCC every year as part of the U.S. commitment under United Nations Framework on Climate Change. In 2018, U.S. forests and harvested wood products were a net sink on the order of 663 million metric tons CO2e, which offsets about 10 percent of the nation’s GHG emissions.22
The FIA program can also provide information about trends on different forest ownership and types, as well as impacts of growth, mortality, and harvest in different regions over time. For example, the amount of forest area has remained constant since about 1900, and U.S. forests have been net sequesterers since the 1950s. During this same period, harvests have remained stable or have increased in some cases, such as in the U.S. South.23
Every 10 years, the USFS reports on the state of the U.S. forests as well as future projections through the Resources Planning Act mandate, established by the Forest and Rangeland Renewable Resources Planning Act of 1974. The most recent report found the following highlights:24
- Forest and woodland area in the United States has plateaued at 823 million acres following decades of expansion. Forest land area alone occupies 766 million acres. Together, forest and woodlands comprise more than one-third of the U.S. landscape and contain 1 trillion cubic feet of wood volume—enough wood to fill the Great Pyramid of Giza 12,000 times.
- Forest industry in the United States makes up 17 percent of global roundwood production, and the nation has the highest intensity of industrial roundwood consumption per capita. The impact of the 2007 recession on wood product demand is still reflected in inventory data, with a 19 percent decline in Southern timber removals between 2006 and 2016. However, that trend should reverse as housing markets continue to recover.
- While forest land is becoming more accessible to people and 67 percent of forest land is legally available for harvest activities, tree cutting and removal occurs on less than 2 percent of forest land per year. Contrast that with the nearly 3 percent disturbed annually by natural events like insects, disease, and fire.
- Wildfire, insects, and disease are among the biggest threats to forests and woodlands in the nation. Low harvest rates, aging forests, mortality from insect and disease infestations, and extreme weather events have combined to create conditions that facilitate wildfire.
Changing environmental conditions have made the active management of forests critical. For example, wildfire is a natural and inherent part of the forest cycle. Today, however, wildfires must be prevented from burning unchecked because of danger to human life and property. As a result, many forests have become over-mature and overly dense with excess debris, which, combined with more extreme weather, has caused an increase in both the number and severity of wildfires.
The combination of older forests and changing climate is also having an impact on insects and disease, causing unprecedented outbreaks, such as the mountain pine beetle, which further add to the fire risk. Active forest management, which includes thinning overly dense forests to reduce the severity of wildfires, helps to ensure that forests store more carbon than they release. Forest management activities aimed at accelerating forest growth also have the potential to increase the amount of carbon absorbed from the atmosphere.
The Canadian Forest Service also tracks the health and productivity of Canada’s forests. Canada is the third-most forested country in the world with 857 million acres forest with low levels of land-use change, just like in the United States. Only 0.3 percent of standing wood volume and less than half of 1 percent of land area was harvested in 2017. Disturbances have a much larger impact on Canada’s forest area and inventory, impacting almost three times the area that was harvested in 2017.25
How Would an Increase In Demand For Wood Products Impact Forests?
Many builders and architects are concerned with the impact of increased demand for wood products on forests. Through both empirical evidence as well as economic models, we have found that demand for wood products results in more forest land, not less. One USFS study noted, “In general, the data show that global regions with the highest levels of industrial timber harvest and forest product output are also regions with the lowest rates of deforestation." The study goes on to add, "The alternative economic hypothesis suggests that forest products and industrial roundwood demands provide revenue and policy incentives to support sustainable forest management, and, in turn, industrial timber revenues and economical forest management have helped avoid large-scale systematic deforestation in those regions with the highest levels of industrial timber harvest.”26
Markets provide economic justification for sustainable forests and good forestry practices. The USFS states in the 2010 RPA assessment that, “Enhancing the flow of timber revenues helps to sustain forest management and provides an economic rationale for policies favoring sustainable forests and good forestry practices. If future technology development and wood demands provide enhanced timber revenues, then historic experience suggests that forests and forest management will thrive. If the value of timber declines, however, through low-value use, limited demand, or insufficient forest product technology development, the future sustainability of forests will be compromised.”27
The Intergovernmental Panel on Climate Change (IPCC) also concludes: “Sustainable forest management aimed at providing timber, fiber, biomass, non-timber resources, and other ecosystem functions and services can lower GHG emissions and can contribute to adaptation.”28
Increasing demand for timber can also increase carbon storage in product stocks and substitution benefits. According to the Forest Climate Working Group, which collaborates on forest carbon strategy and policy recommendations, the current inventory of wood structures in the United States is estimated to store 1.5 billion metric tons of carbon, which is equivalent to 5.4 billion tons of CO2. Most of this resides in the nation’s housing stock, about 80 percent of which is wood-frame construction. Increasing wood use to the maximum extent feasible in multifamily housing, low-rise non-residential construction, and remodeling could result in a carbon benefit equal to about 21 million metric tons of CO2 annually—the equivalent of removing 4.4 million cars.
Conclusion: Wood Supports a Sustainable Future
With growing pressure to reduce the environmental impacts of buildings, architects and engineers are looking beyond operational performance to the role of structural materials. In addition, clients are increasingly seeking buildings that meet or exceed green building codes or carbon policies. According to an analysis by the International Finance Corp., there is a business opportunity of almost $25 trillion associated with green buildings in emerging markets between now and 2030.29
Reasons to use wood to achieve a project’s sustainability goals are in many ways intuitive. Wood grows naturally, is renewable, and has advantages from a carbon footprint perspective. It is also durable, adaptable, and can have positive impacts on a building’s occupants. However, understanding a material’s impacts at every stage of its life is essential—and LCA studies consistently show that wood has a favorable environmental profile compared with functionally equivalent products made from other materials.
The use of wood also supports healthy demand for timber, which keeps land in forests and provides an incentive to grow more trees. Thus, increase in demand for wood can support investment in forests and ultimately increase supply. Forests can be managed to protect water quality, wildlife, soil, and areas of high conservation value. Assurances can be made through forest certification, responsible fiber sourcing certification, and state regulatory or voluntary best management practices. A wood building’s relatively low embodied footprint, carbon storage, and ties back to the forest provide a full suite of climate benefits.
The 2016 FAO report concluded, “Forests and forest products have a key role to play in mitigation and adaptation, not only because of their double role as sink and source of emissions, but also through the potential for wider use of wood products to displace more fossil-fuel intense products. Indeed, a virtuous cycle can be enacted in which forests increase removals of carbon from the atmosphere while sustainable forest management and forest products contribute to enhanced livelihoods and a lower carbon footprint.”30
It is worth reiterating that no one material is the best choice for every application. There are tradeoffs associated with each, and each has benefits that could outweigh the other material choices based on a project’s design objectives. It is important that specifiers be assured that using wood in North America can be part of a climate solution.
Edie Sonne Hall, Ph.D., has more than 20 years of experience in forestry, with expertise in carbon accounting, ecosystem services, life-cycle assessment, certification, and environmental and sustainability policy across local, federal, and international domains, working with the largest landowners in the world through to family farm forest organizations.
END NOTES
1Architecture 2030
2architecture2030.org/new-buildings-embodied
3architecture2030.org/2030_challenges/embodied
4A Synthesis of Research on Wood Products and Greenhouse Gas Impacts, FPInnovations, 2010
5awc.org/publicpolicy/biomass
6Pekka Leskinen, Giuseppe Cardellini, Sara González-García, Elias Hurmekoski, Roger Sathre, Jyri Seppälä, Carolyn Smyth, Tobias Stern and Pieter Johannes Verkerk. 2018. Substitution effects of wood-based products in climate change mitigation. From Science to Policy 7. European Forest Institute.
7Miner, R. & Gaudreault, C. 2016. Research Case 1: The potential of HWP in mitigation: additional storage of carbon in primary wood products. In Background papers on forests for a low-carbon future. Rome, FAO (in press).
8Estimates using Wood Works Carbon Estimator
9TRACI is a life cycle assessment methodology developed by the US EPA and the most commonly used method in North America.
10Athena Sustainable Materials Institute. 2019. User Manual and Transparency Document: Impact Estimator for Buildings v.5.
11Woodworks. 2015. Big Box Retail Comparison. WoodWorks Case Study WW-019.
12ISO. 2017. Sustainability in buildings and civil engineering works- Core rules for environmental product declarations of construction products and services. International Organization for Standardization. Second edition (ISO 21930:2017-07) 80pp.
13NC State University College of Agriculture & Life Sciences
14From USFS Office of Sustainability and Climate. 2019
15Salazar, J. “How LCA Handles Wood”, presentation to Carbon Leadership Forum’s Wood Carbon Seminar, May 7, 2020.
16Puettmann, M. 2020. The Role of Wood Products and Biomass Energy on Carbon Stores and Emissions. Chapter 4: In Carbon in Oregon’s Managed Forests. Cloughesy, M. and E.S. Hall (eds). Oregon Forest Resources Institute.
17364 million acres SFI; 158.2 million acres FSC; 17.6 million acres ATFS (US), American Tree Farm System, contacted June 2020; ~estimated 100 million CSA from SFI report as well as CSA SFM User Group
18State of Canada’s forests reports that 406 million acres land (47 percent total) certified under third-party certification
19National Forest Certification Study; An Evaluation of the Applicability of Forest Stewardship Council (FSC) and Sustainable Forest Initiative (SFI) Standards on Five National Forests, Pinchot Institute for Conservation
20www.stateforesters.org/wp-content/uploads/2018/10/Protecting_Water_Quality_through_State_Forestry_BMPs_FINAL.pdf
21State of America’s Forests. 2019
22www.epa.gov/ghgemissions/inventory-us-greenhouse-gas-emissions-and-sinks
23Oswalt, S.N., B.W. Smith, P.D. Miles, and S.A. Pugh. 2018. Forest Resources of the United States, 2017. A technical document supporting the Forest Service 2020 RPA assessment. Washington, DC: U.S. Forest Service.
24Ibid.
25Natural Resources Canada. 2019. The State of Canada’s Forests Annual Report 2019
26Ince, Peter. 2010. Sustainable development in the forest products industry, Chapter 2. Porto, Portugal : Universidade Fernando Pessoa, 2010: p. 29-41. ISBN: 9789896430528
27USFS, 2012: Future of America’s forest and rangelands: 2010 Resources Planning Act assessment. General Technical Report WO-87. 198 pp., U.S. Department of Agriculture, U.S. Forest Service, Washington, D.C.
28IPCC. 2019. IPCC Special Report on Climate Change, Desertification, Land Degradation, Sustainable Land Management, Food Security, and Greenhouse gas fluxes in Terrestrial Ecosystems.
29www.enr.com/articles/48389-a-call-to-action-for-engineers-on-climate-change
30FAO. 2016. Forestry for a Low Carbon Future.