


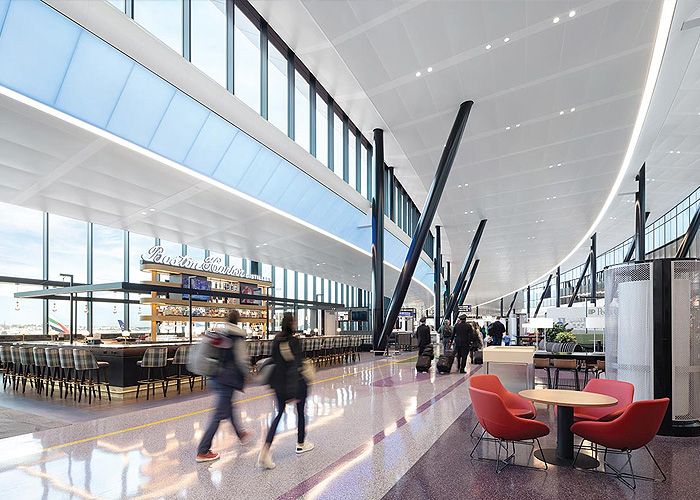
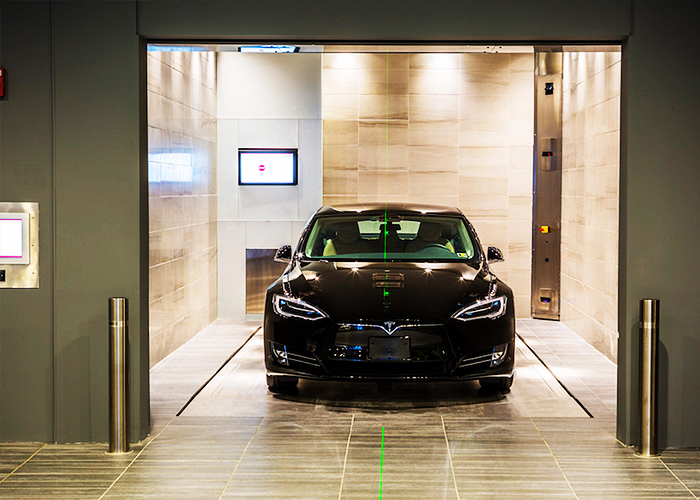
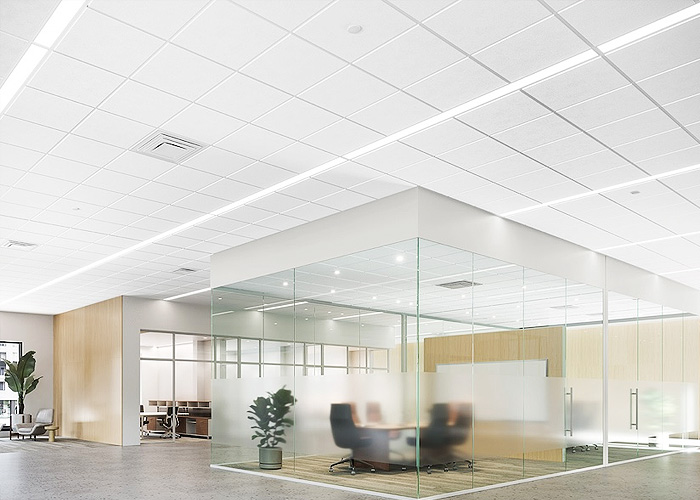
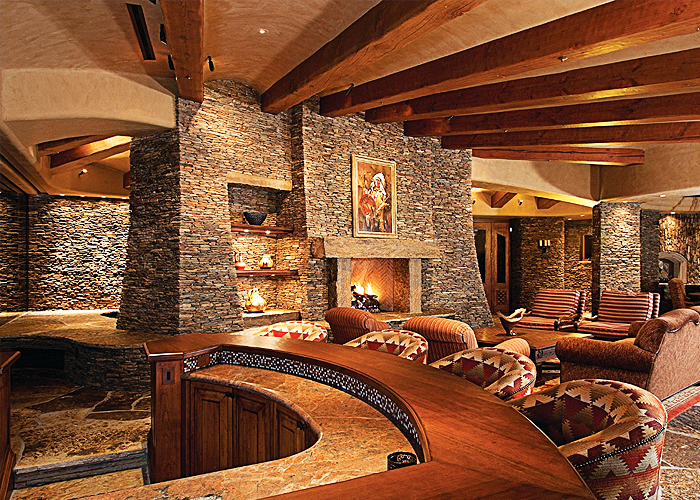
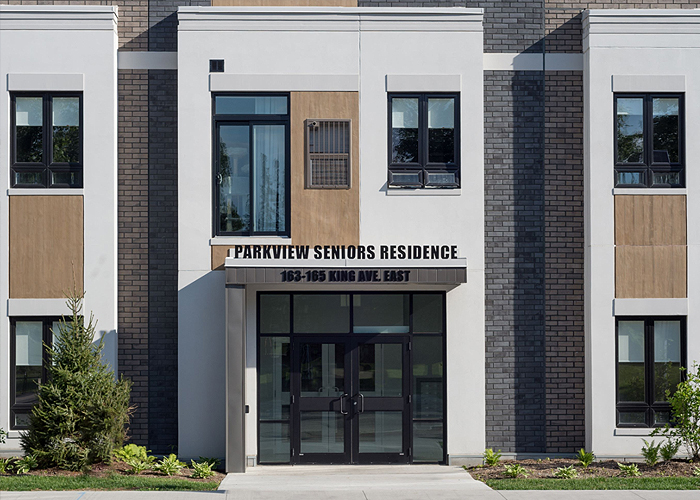
Systems can meet many different needs and design goals
Sponsored By Arktura
Credits: AIA, GBCI, ICC
Type: Article
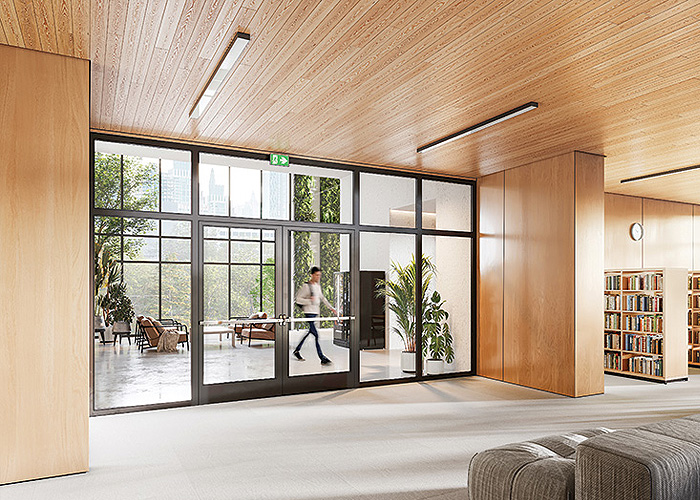
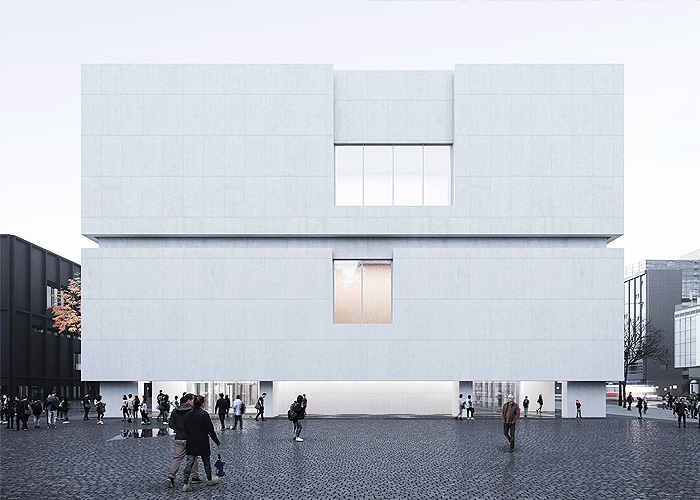
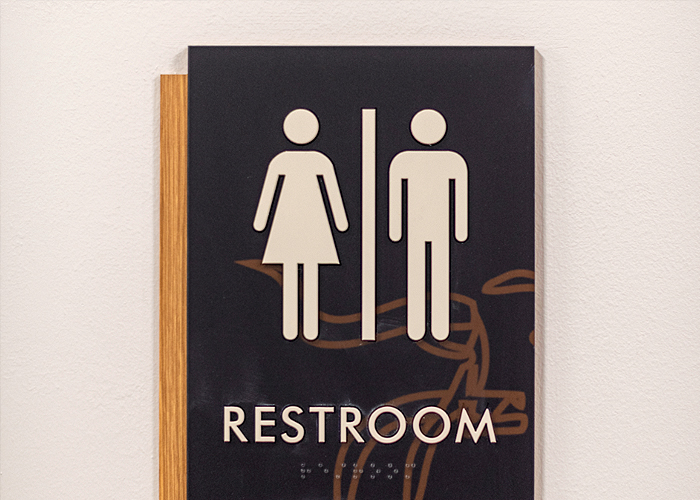
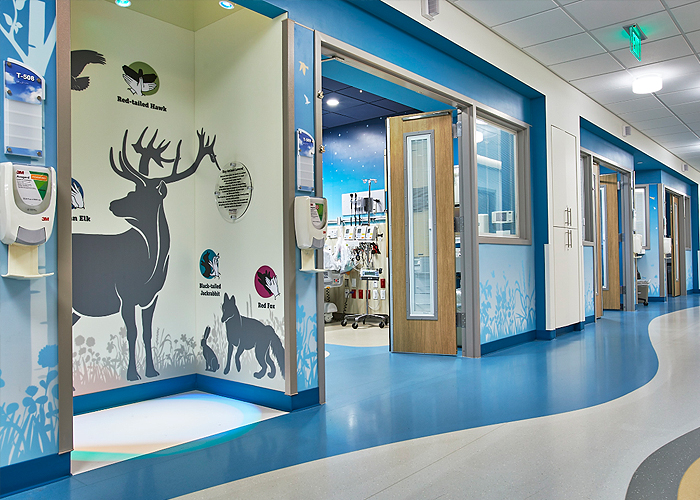
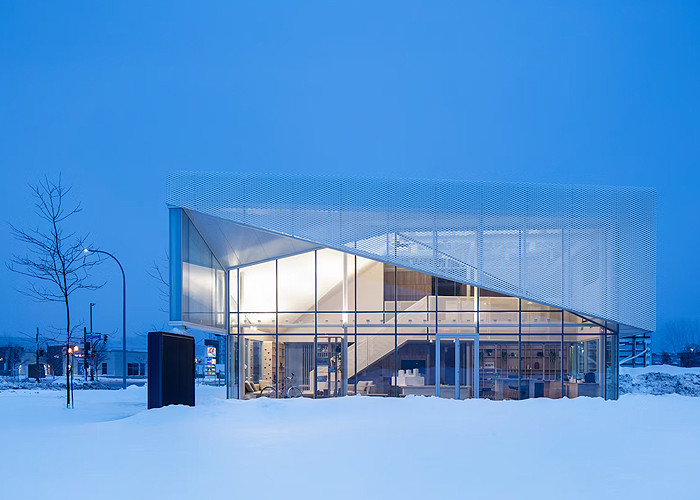
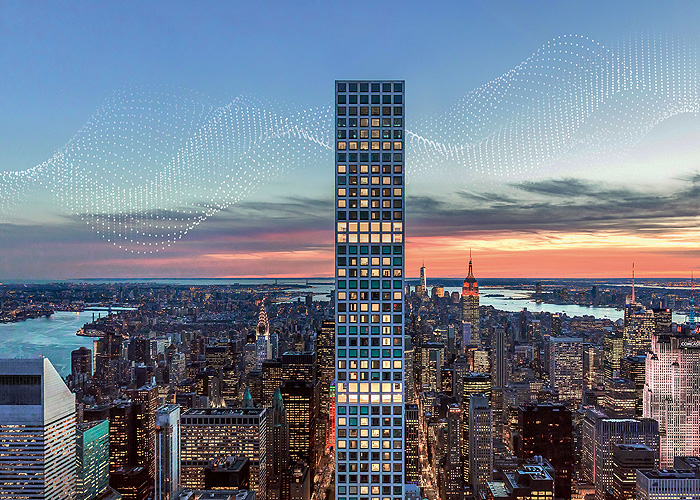
Advances in technology increase sustainability, views, and installation ease
Sponsored By Vetrotech Saint-Gobain North America
Credits: AIA, GBCI, ICC
Type: Article
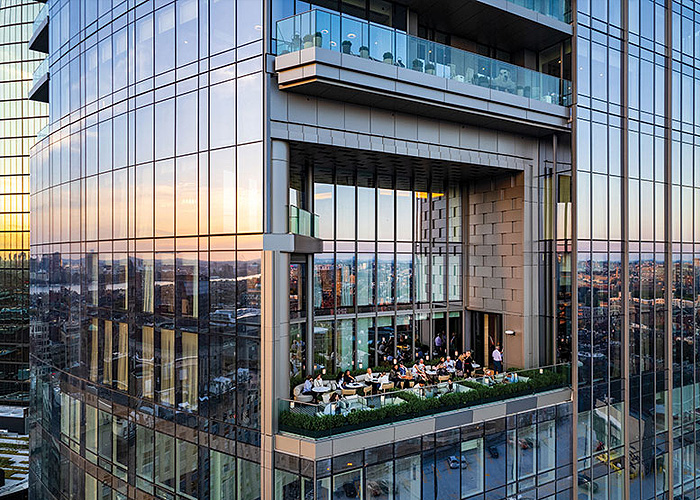
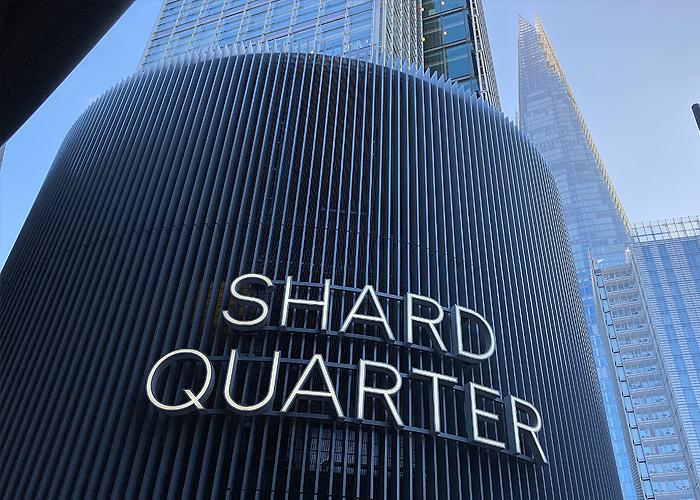
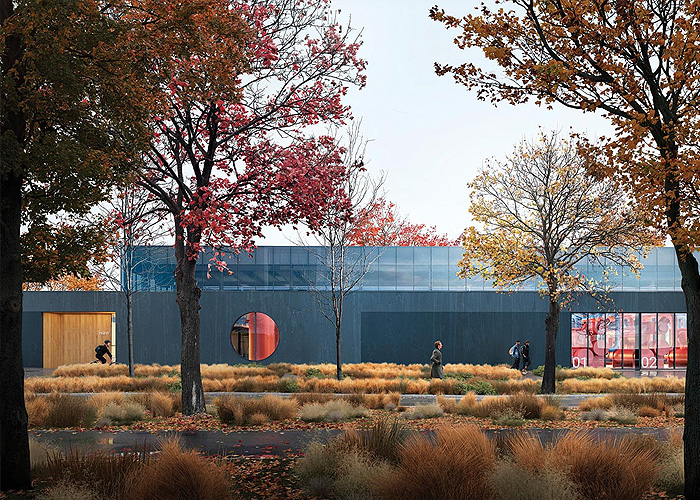
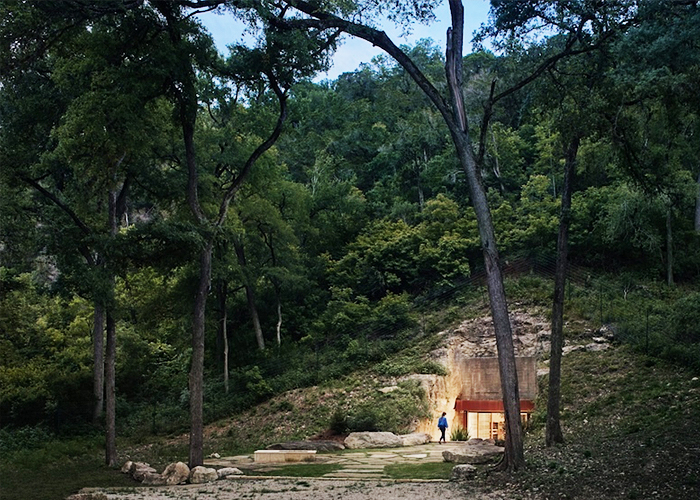
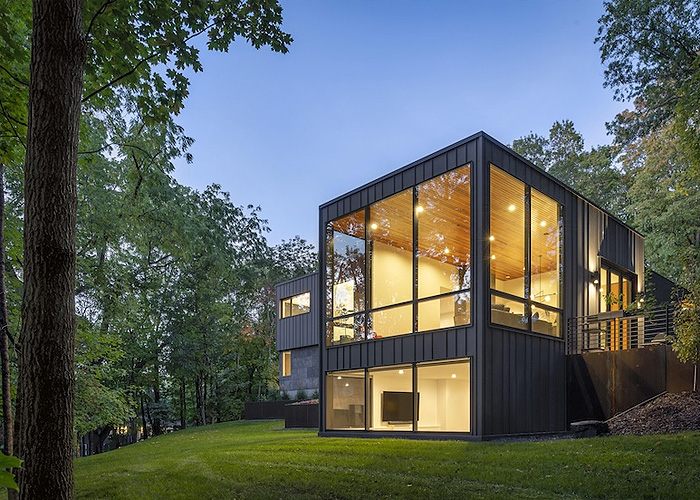
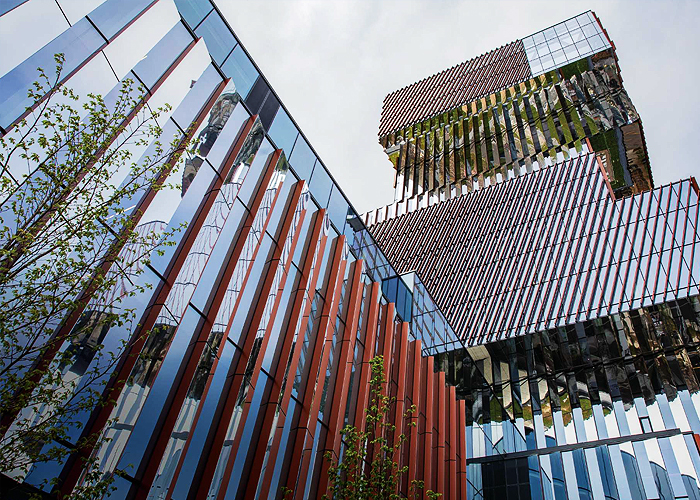
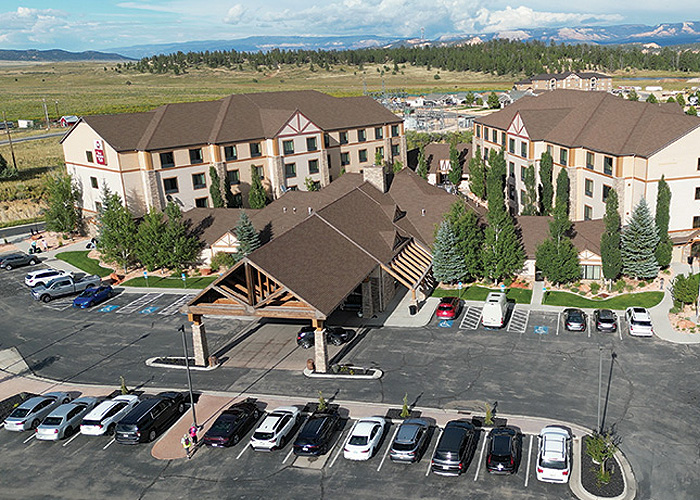
Will your facade last a few decades or a millennium?
Sponsored By The Ornamental Metal Institute of New York
Credits: AIA, GBCI, ICC
Type: Article
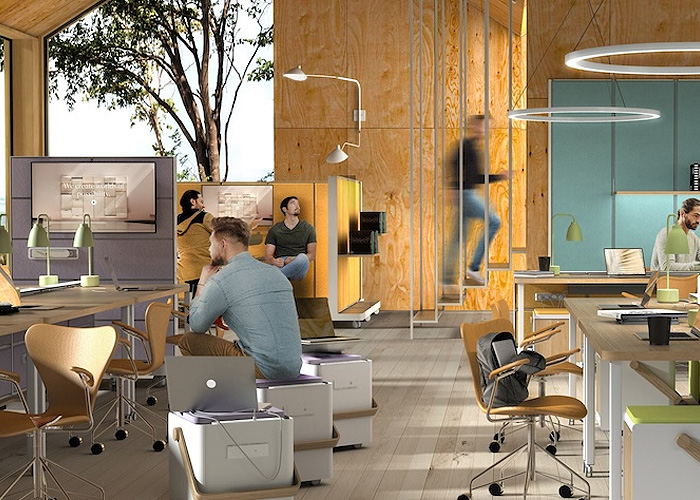
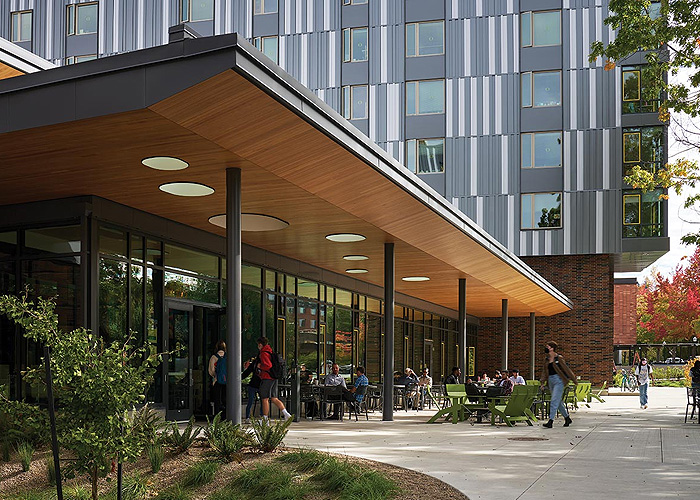
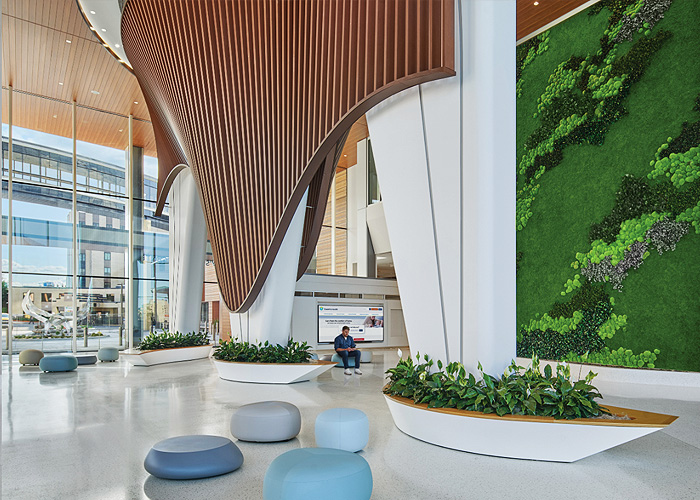
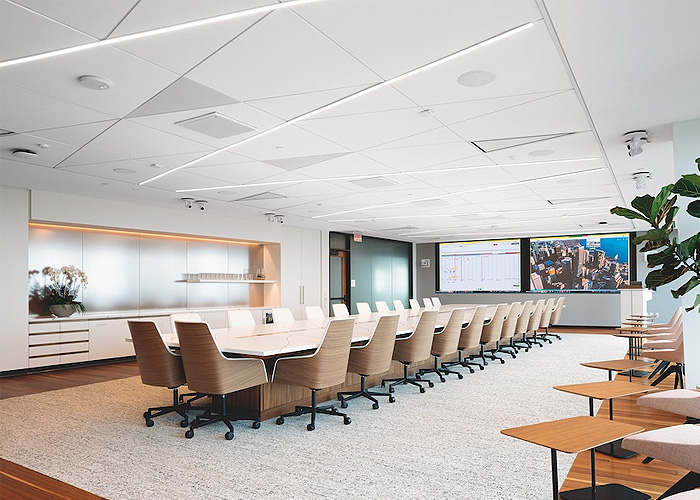
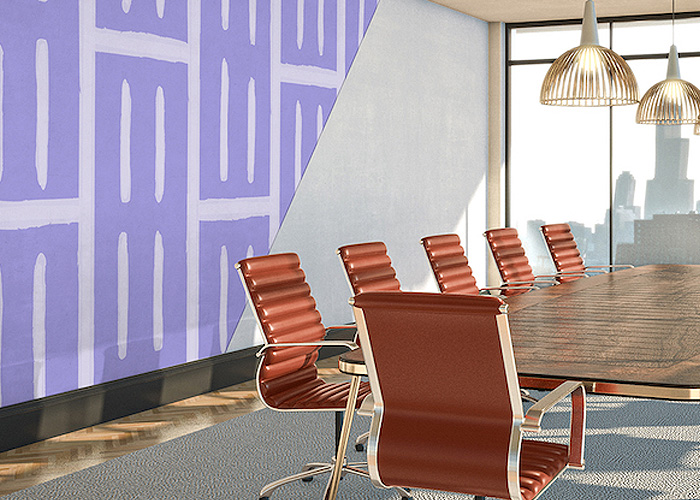
How to design a dynamic workplace
Sponsored By B+N Industries
Credits: AIA, GBCI, ICC, IDCEC
Type: Multimedia
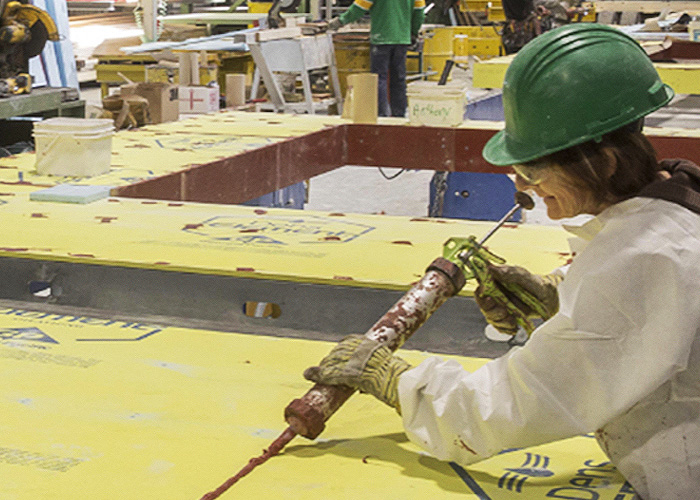
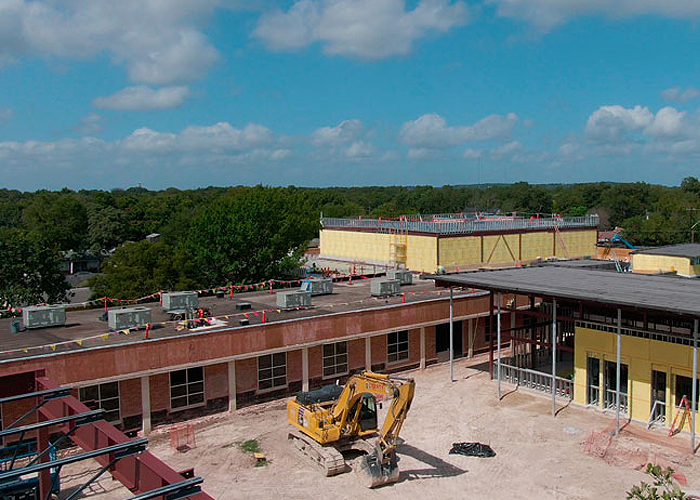
Integrated sheathing is a key component
Sponsored By Georgia-Pacific Building Products
Credits: AIA, ICC
Type: Multimedia
Credits: AIA
Type: Podcast
Credits: AIA
Type: Article

Credits: AIA
Type: Article
Credits: AIA, ICC
Type: Article
Credits: AIA, ICC
Type: Article
Credits: AIA, ICC
Type: Article
.jpg)
Credits: AIA, ICC
Type: Article
Credits: AIA, ICC
Type: Article
Credits: AIA, ICC
Type: Article

Credits: AIA, ICC
Type: Article
Credits: AIA, ICC
Type: Article
Credits: AIA, ICC
Type: Article
Credits: AIA, ICC
Type: Article
Credits: AIA, ICC
Type: Article

Credits: AIA
Type: Article
Credits: AIA
Type: Article

Credits: AIA, ICC
Type: Multimedia

Credits: AIA, ICC
Type: Multimedia

Credits: AIA, ICC
Type: Multimedia

Credits: AIA, ICC
Type: Multimedia
Credits: AIA
Type: Article

Credits: AIA, GBCI, ICC
Type: Article

Credits: AIA, GBCI, ICC
Type: Article

Credits: AIA, ICC
Type: Article

Credits: AIA
Type: Podcast
Credits: AIA, ICC
Type: Webinar On-Demand
Credits: AIA
Type: Podcast

Credits: AIA, ICC
Type: Article

Credits: AIA, ICC
Type: Webinar On-Demand
Credits: AIA, GBCI, ICC
Type: Article
Credits: AIA, GBCI, ICC, IDCEC
Type: Multimedia
Credits: AIA, ICC
Type: Webinar On-Demand

Credits: AIA
Type: Article

Credits: AIA, ICC
Type: Article

Credits: AIA, ICC
Type: Webinar
Feb 4 2025 2:00 PM EST

Credits: AIA, ICC, IDCEC
Type: Multimedia
Credits: AIA, GBCI, ICC
Type: Article

Credits: AIA, ICC
Type: Webinar On-Demand
Credits: AIA
Type: Multimedia
Credits: AIA
Type: Webinar On-Demand
Credits: AIA, GBCI, ICC
Type: Multimedia

Type: Webinar On-Demand

Credits: AIA, ICC
Type: Webinar On-Demand
Credits: AIA, GBCI, ICC
Type: Multimedia

Credits: AIA, GBCI, ICC
Type: Article

Credits: AIA
Type: Podcast

Credits: AIA, ICC
Type: Article

Credits: AIA, ICC
Type: Webinar On-Demand

Credits: AIA
Type: Webinar
Feb 12 2025 2:00 PM EST

Credits: AIA, ICC
Type: Webinar
Feb 25 2025 2:00 PM EST

Credits: AIA, ICC
Type: Webinar
Feb 12 2025 2:00 PM EST
Credits: AIA
Type: Podcast
Credits: AIA
Type: Article
Credits: AIA, ICC
Type: Webinar On-Demand

Credits: AIA, GBCI, ICC
Type: Article
Credits: AIA, GBCI, ICC
Type: Article
Credits: AIA
Type: Article
Credits: AIA, GBCI, ICC
Type: Article

Credits: AIA, GBCI, ICC
Type: Article

Credits: AIA, GBCI, ICC
Type: Article

Credits: AIA, ICC
Type: Article

Credits: AIA, ICC
Type: Webinar On-Demand

Credits: AIA, ICC
Type: Webinar On-Demand
Credits: AIA, ICC
Type: Webinar On-Demand

Credits: AIA, GBCI, ICC
Type: Multimedia
Credits: AIA
Type: Article
Credits: AIA
Type: Article

Credits: AIA, GBCI, ICC
Type: Article

Credits: AIA, GBCI, ICC
Type: Multimedia

Credits: AIA, GBCI, ICC
Type: Multimedia

Credits: AIA, GBCI, ICC
Type: Article

Credits: AIA, GBCI, ICC
Type: Multimedia

Credits: AIA, ICC
Type: Webinar On-Demand

Credits: AIA, GBCI, ICC
Type: Article

Credits: AIA, ICC
Type: Article
Credits: AIA, ICC
Type: Webinar On-Demand

Credits: AIA, ICC
Type: Webinar On-Demand
Credits: AIA
Type: Multimedia
Credits: AIA, ICC
Type: Article
Credits: AIA, ICC
Type: Podcast