This CE Center article is no longer eligible for receiving credits.
Photometric reports summarize and graphically illustrate how a fixture distributes light with a candela chart and in a polar graph called a candela distribution curve. Looking at these reports, a specifier can quickly compare the distribution patterns of multiple fixtures and determine which fixture seems best equipped to meet the illumination needs of the space. Designers can also use these reports to deduce whether or not a fixture has the potential to produce glare or unwanted striations.
The Candela Chart
The candela chart is an at-a-glance summary of the light intensities (measured in candelas) distributed by a fixture into specific areas of the surrounding space. The candela chart organizes the candela values in terms of the horizontal and vertical coordinates of their location around the fixture. The horizontal coordinate refers to a unique viewing position, called a horizontal viewing angle, which exists along an imaginary circle around the horizontal axis of the fixture. The vertical coordinate refers to various heights, or vertical angles, along a vertical plane located at each unique horizontal viewing position.
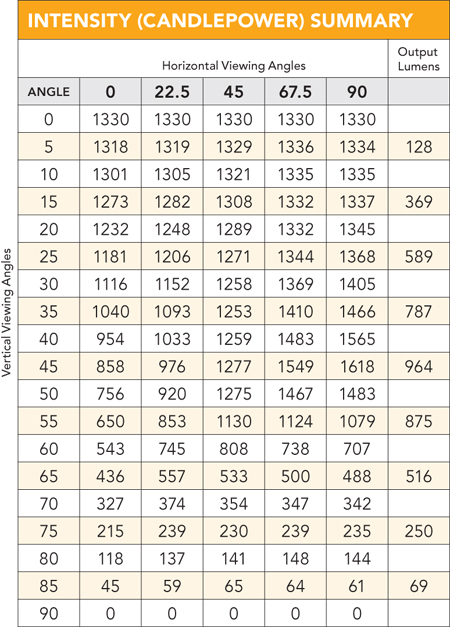 |
This candela chart displays the light intensities of complete vertical planes as measured from five distinct horizontal viewing locations. |
Imagine a hanging, 2-by-4 linear direct/indirect troffer fixture. Visualize the horizontal axis of the fixture, running through the fixture end-to-end. Now draw an imaginary circle around the horizontal axis of the fixture, so that one end of the fixture rests at 0 degrees and the other end rests at 180 degrees. Now imagine a person walking around the fixture on the imaginary circle. Every few steps, the person stops to admire the fixture. The location where they stop to view the fixture is an example of a horizontal viewing angle. A candela chart will typically contain between three and five unique horizontal viewing positions on that circle, denoted as angle measurements. Five horizontal viewing angles commonly seen in a candela chart are 0, 22.5, 45, 67.5, and 90 degrees.
 |
Batwing pattern and spherical pattern as
observed at a 90° horizontal viewing angle
Image courtesy of Prudential Lighting |
Now, imagine a ladder at each of the five horizontal viewing angles on the circle, so there are five ladders on the imaginary circle. Each ladder represents a vertical axis and it is positioned so that the fixture is in the center of the ladder, with rungs extending in equal distances above and below. The bottom of the ladder denotes 0 degrees on the vertical axis, the top of the ladder is 180 degrees on the vertical axis, and the center of the lighting fixture should be at 90 degrees. There can be as few rungs or as many rungs on the ladder as necessary, depending upon the level of detail contained in the candela chart. Some candela charts will step up the vertical axis in 5-degree increments, others in 2.5-degree increments, and so on. The vertical viewing angles referenced in the candela chart refer to the various rungs on the ladder placed at each unique viewing position. All of the measurements taken from one ladder, or vertical axis, represent the vertical plane at that specific horizontal viewing angle.
If the fixture emitted a perfectly symmetrical pattern of light in all directions, the entire lighting distribution pattern could be detailed from one vertical plane of measurements taken at one horizontal viewing position. However, most fixtures do not emit a symmetrical pattern of light in all directions, so more measurements need to be taken, which accounts for why most candela charts contain between three and five horizontal viewing angles and the measurements from their associated vertical planes.
The candela chart displays the horizontal viewing angles across the top as the column headings and the vertical viewing angles (in increments between 0 and 180 degrees) as the row headings. For example, look at the candela chart shown on the opposite page. The unique horizontal viewing angles (0, 22.5, 45, 67.5, 90) are charted across the top as the column headings. The viewing angles, staggered in 5-degree increments between 0 and 90 degrees, are the row headings. The various candela measurements taken along the vertical plane at each unique horizontal position are contained within the chart.
Commercial fixtures today commonly distribute light in either a spherical pattern or a batwing pattern. A spherical pattern of light resembles a ball stuck to the fixture and the batwing pattern of light resembles a bat, with wings spread, going headfirst into the fixture. It is by plotting the information captured on the candela chart into a candela distribution curve that the pattern of light emitted by the fixture is realized.
 |
The candela distribution curve illustrates
that this fixture distributes light in a batwing pattern.
Image courtesy of Prudential Lighting |
The Candela Distribution Curve
The measurements from the candela chart are plotted onto a polar graph to create a candela distribution curve. The candela distribution curve graphically illustrates the lighting distribution pattern of the fixture. This circular (or semi-circular) graph places the light source at the center and maps the various light intensities (in candelas) in incremental steps up the vertical plane (0-180 degrees) for a single horizontal viewing angle. The plots for multiple horizontal viewing angles can be laid over one another onto one distribution curve to better illustrate changes in the direction and intensity of light output that a person would experience as they walked around the fixture from one horizontal viewing angle to another.
Look at the candela distribution curve shown at left. This one polar graph contains three vertical viewing planes taken from three horizontal viewing positions (0, 45, and 90 degrees). Notice that the graph illustrating the vertical viewing plane at 90 degrees has a distinct batwing shape.
A Few Quick-Read Characteristics
There are a few important characteristics about the lighting fixture and how the lighting fixture will perform in a space that are quickly revealed by referencing the candela distribution curve. It can be an easy way to compare the lighting distribution of multiple fixtures of interest. First, the distribution curve will illustrate if the fixture is direct (emits light only between 0 and 90 degrees on a vertical axis), indirect (emits light only between 90 and 180 degrees on a vertical axis), or direct/indirect which emits light both above and below the fixture (0 to 180 degrees on the vertical plane).
As you prepare to read this article either in a magazine or online on your computer screen, take a quick survey of the lighting in the immediate area. Look up at the overhead fixture, referred to by many in the lighting design community as a luminaire. Is it aesthetically pleasing or does it seem to have been designed to be ignored? More importantly, does the fixture put the right amount of light in the right locations? Do you have enough light to be able to read comfortably or are your eyes straining to make out the words or squinting to block out an overly bright overhead light? Is the fixture causing an irritating and eye-fatiguing glare on the screen? Good lighting is necessary for creating a functional and productive workspace. Poor lighting often provides the setting for sore eyes.
Until recently, creating a good lighting environment was a challenge in compromise. It was almost impossible to find a fixture that looked good, could put the necessary amount of light on the work surface, in a way that was efficient and fit within the client's budget. Too often designers were unknowingly forced to choose between a functional space, an efficient space, and a budget-friendly space. They selected highly efficient or inexpensive fixtures that created poor lighting environments, because the fixtures were unable to provide light where it was needed, at the recommended levels, or in a uniform fashion. The efficient and effective fixtures were prohibitively expensive, requiring significant cost trimming in other areas to stay within the project's budget.
The good news is that today compromise for good lighting is no longer necessary. Technological advancements in light sources and fixture design now offer the specification community the rare opportunity to select aesthetically pleasing lighting fixtures that provide the right light, with greater energy efficiency, in a way that actually saves money in materials and maintenance. The secret is knowing what to look for in a fixture.
 |
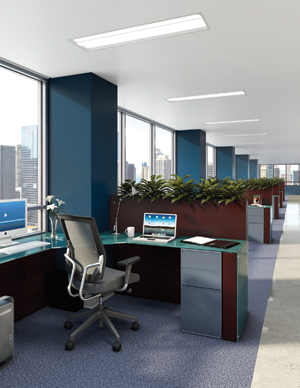
Good workplace lighting must provide the necessary amount of light, while protecting the visual environment from glare and remaining within the allowable energy footprint.
Photo courtesy of Prudential Lighting |
Productive Workspaces and Good Lighting
The most basic design goals in an office or commercial setting are to create a place where work can be accomplished, communication can occur, and business can be conducted. Light is instrumental in creating that productive environment. The inextricable relationship between lighting and productivity is due to the fact that people use their eyes to interpret and interact with the world around them, and the human eye requires light.
In short, the cornea bends rays of light, reflected by the object of interest, through the pupil, which is the dark, round opening in the middle of the colored iris. The light is focused onto the retina in the back of the eye. Photoreceptor cells in the retina transform the light into an electrical impulse that is sent through the optic nerve to the brain. Without the appropriate amount of light, a person's ability to perform a visual task, such as reading email, reviewing a spreadsheet or watching a slide presentation, is compromised and they must spend time and energy adjusting, both consciously and unconsciously, to see the materials better. This immediately diminishes their productive time and efforts to create, analyze or respond.
Provide the Right Amount of Light in the Right Location
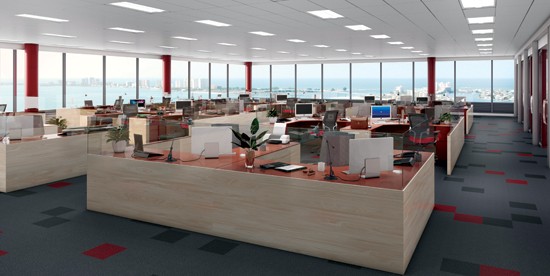
In order to select fixtures that will provide an appropriate visual environment and productive workspace, start by identifying the visual tasks that will be performed in the area and the amount of light necessary for a person to perform them. The Illuminating Engineering Society of North America (IESNA) has developed recommendations, highly regarded throughout the industry, that outline optimal light levels for performing various visual tasks or the amount of light best suited to specific types of space. The IESNA 9th Edition Handbook recommends that lighting systems in office buildings be designed to maintain 400 lux (40 footcandles) at the working level in a single office, 400 lux (40 footcandles) at the working level in open-plan offices, and 300 lux (30 footcandles) at the working level in a conference room. It is interesting to note that these recommended light levels assume that the majority of office work is computer based. When paper-based reading tasks were the primary office function, recommended light levels ranged between 750 and 1,000 lux (75-100 footcandles) at the working level.
As was alluded to in the wording of the IESNA recommendations, to create an optimal visual environment, fixtures must do more than provide the recommended amount of light, they must provide it at the working level, also referred to as the work plane. In the office setting, the IESNA recommendations identify the work plane as being roughly 2.5 feet high, generally regarded as a typical desk height. In corridors, stairwells, and restrooms, denoted by the IESNA as circulation areas, the optimal light levels must be maintained on the floor, enabling occupants to move safely through the spaces.
The Importance of the Optical System
It is the optical system within a fixture that takes the light emitted by the lamp and distributes it into the interior space. The design of the optical system determines if the fixture has the control to spread a pleasant, uniform light into the specific areas it is needed or if the light leaves the fixture in a more haphazard manner, invariably ending up in places that it is and is not wanted with varying degrees of uniformity.
 |
The IESNA recommends that an open-plan
office maintain 400 lux (40 footcandles) at
the working level.
Photo courtesy of Prudential Lighting |
There are three components that work together to form the optical system in even the most basic light fixture. They are: the lamp, the lens, and the reflector (also referred to as the fixture housing). The lamp emits the light. The lens is the material that the light passes through as it enters into the interior environment. As the lamp emits light, not all of the light immediately passes straight through the lens. Fluorescent lamps, for example, emit light of the same intensity in a full 360 degrees around the lamp. Even if the lens was of a sufficient size and design to catch and transmit the light emitted from 180 degrees of the lamp, the remaining 50 percent of the light emitted by the lamp is not aimed directly at the lens. The reflector is the enclosure around the lamp that reflects any remaining light back out through the lens.
A rudimentary optical system may consist of no more than a lamp in a metal box that has been painted white, so that it reflects light, instead of absorbing it, and a basic lens, which is essentially a generic piece of clear prismatic acrylic or glass that protects the lamp from accumulating dust. This is the type of optical system often found in the traditional recessed, lensed, troffer luminaires commonly installed throughout office buildings and other commercial facilities.
Unfortunately, the simple design of these types of optical systems severely limits both the efficiency of the fixture and its ability to control the placement of the light it provides. Poor efficiency is the result of poor internal light management. These basic metal box fixtures are typically not designed to direct the reflected light out of the box as quickly as possible and, instead, allow the light to bounce randomly around inside the fixture, losing energy and intensity with every extra reflection. Poor light placement is the result of the rudimentary reflector and basic lens having no ability to direct the light into the areas it is needed and instead allowing light rays to scatter indiscriminately into the interior space or concentrate on one particular area, causing a visual hot spot or glare.
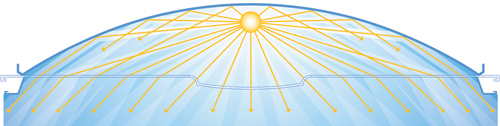 |
The lamp, the lens, and the reflector work together to form the optical system in a light fixture.
Image courtesy of Prudential Lighting |
Prevent Glare
Glare is perhaps one of the biggest stumbling blocks for achieving a productive workspace. Glare occurs when a light source, or the reflection of a light source, is significantly brighter (generally more than three times brighter) than the ambient area surrounding it, causing visual discomfort.
The visual discomfort is the result of the human eye's inability to adapt appropriately to the extreme contrast in the light intensities within its field of vision. Adaptation is a chemical process that takes place on the surface of the retina, regulating the eye's sensitivity to light. In bright environments, this sensitivity decreases because more visual stimulus is available. In darker settings, sensitivities increase.
The change in sensitivity is uniform across the eye, leaving few options to compensate for hot spots and areas of irregularity. When the eye's sensitivity to light decreases to accommodate the brightest object in view, the surrounding areas become too lowly lit to be seen clearly. When the eye's sensitivity to light increases to interpret the dimmer surroundings, the intensity of the brighter object becomes glaring and uncomfortable.
Accommodation is the physiological response that compensates for shortcomings in adaptation. Accommodation is the muscular process that limits the amount of light entering the eye by constricting the pupil and squinting. People can also accommodate their visual environments by lowering their heads and furrowing their brows. This is often an unconscious, automatic response, like blinking when the eyes are dry.
 |
More deliberate reflector design and advanced lens materials enable optical systems to offer
better fixture efficiency and light control.
Image courtesy of Prudential Lighting |
In an office space, an employee could be subjected to glare for several hours nearly every day. Physically unable to adapt to glaring conditions, employees spend their days accommodating the visual environment with involuntary contractions of the pupil, squinting, changing the position of their head, and furrowing their brows. Repetitive use of these accommodation tactics can lead to stress injuries and muscle fatigue that manifest in the forms of eye strain, headaches, and computer vision syndrome. These problems are uncomfortable, fatiguing, and contribute to decreased productivity in the workplace.
Over the years, two common responses for combating glare in the commercial environment emerged. Less reflective, matte computer screens replaced their glossy predecessors in droves and fixture manufacturers added a pattern or opacity to the lens that more actively diffused the light and better obscured the lamp, in an attempt to eliminate glare-causing hot spots. Unfortunately, neither of these solutions did anything to improve the energy efficiency of the lighting system or to better project light into the areas where it was needed.
Today, rising energy costs and the public's renewed love affair with glossy screens have given specifiers a need for a new response to combat pesky glare. An ideal solution would simultaneously prevent glare, improve the efficiency of the light environment, and place the IESNA-recommended amount of light at the working level. Sophisticated optical systems, and the lighting fixtures that employ them, are the solution that allows a commercial environment to reinstate the vibrant glossy screens on a computer, tablet or smart phone, without sacrificing productivity to glare, and improving the overall efficiency of the lighting system.
It is with more deliberate reflector design and advancements in lens materials and technology that optical systems are now able to offer better fixture efficiency and light control. Reflectors, in more advanced optical systems, are precision built to reflect light from the lamp through the lens more effectively, minimizing the light energy wasted as the light bounces around within the fixture. Lenses have advanced from lamp dust jackets to powerful optical components. For example, a refractive lens is a lens that has been engineered with refractive prisms inside of it. These refractive prisms bend and distribute the light in a dramatically more controlled manner than the dumb or diffuse lenses previously used, making it possible to achieve IESNA-recommended light levels on the work plane and, at the same time, prevent the presence of unwanted or potentially glare-causing light elsewhere.
Reading Photometric Reports
While manufacturers can provide a copious amount of information on the specific lamp type, reflector, and lens material contained within a fixture, understanding how the components work together to distribute light requires additional information. Specifiers can use photometric reports to predict how a lighting fixture will perform in a space.
Photometric reports summarize and graphically illustrate how a fixture distributes light with a candela chart and in a polar graph called a candela distribution curve. Looking at these reports, a specifier can quickly compare the distribution patterns of multiple fixtures and determine which fixture seems best equipped to meet the illumination needs of the space. Designers can also use these reports to deduce whether or not a fixture has the potential to produce glare or unwanted striations.
The Candela Chart
The candela chart is an at-a-glance summary of the light intensities (measured in candelas) distributed by a fixture into specific areas of the surrounding space. The candela chart organizes the candela values in terms of the horizontal and vertical coordinates of their location around the fixture. The horizontal coordinate refers to a unique viewing position, called a horizontal viewing angle, which exists along an imaginary circle around the horizontal axis of the fixture. The vertical coordinate refers to various heights, or vertical angles, along a vertical plane located at each unique horizontal viewing position.
|
This candela chart displays the light intensities of complete vertical planes as measured from five distinct horizontal viewing locations. |
Imagine a hanging, 2-by-4 linear direct/indirect troffer fixture. Visualize the horizontal axis of the fixture, running through the fixture end-to-end. Now draw an imaginary circle around the horizontal axis of the fixture, so that one end of the fixture rests at 0 degrees and the other end rests at 180 degrees. Now imagine a person walking around the fixture on the imaginary circle. Every few steps, the person stops to admire the fixture. The location where they stop to view the fixture is an example of a horizontal viewing angle. A candela chart will typically contain between three and five unique horizontal viewing positions on that circle, denoted as angle measurements. Five horizontal viewing angles commonly seen in a candela chart are 0, 22.5, 45, 67.5, and 90 degrees.
|
Batwing pattern and spherical pattern as
observed at a 90° horizontal viewing angle
Image courtesy of Prudential Lighting |
Now, imagine a ladder at each of the five horizontal viewing angles on the circle, so there are five ladders on the imaginary circle. Each ladder represents a vertical axis and it is positioned so that the fixture is in the center of the ladder, with rungs extending in equal distances above and below. The bottom of the ladder denotes 0 degrees on the vertical axis, the top of the ladder is 180 degrees on the vertical axis, and the center of the lighting fixture should be at 90 degrees. There can be as few rungs or as many rungs on the ladder as necessary, depending upon the level of detail contained in the candela chart. Some candela charts will step up the vertical axis in 5-degree increments, others in 2.5-degree increments, and so on. The vertical viewing angles referenced in the candela chart refer to the various rungs on the ladder placed at each unique viewing position. All of the measurements taken from one ladder, or vertical axis, represent the vertical plane at that specific horizontal viewing angle.
If the fixture emitted a perfectly symmetrical pattern of light in all directions, the entire lighting distribution pattern could be detailed from one vertical plane of measurements taken at one horizontal viewing position. However, most fixtures do not emit a symmetrical pattern of light in all directions, so more measurements need to be taken, which accounts for why most candela charts contain between three and five horizontal viewing angles and the measurements from their associated vertical planes.
The candela chart displays the horizontal viewing angles across the top as the column headings and the vertical viewing angles (in increments between 0 and 180 degrees) as the row headings. For example, look at the candela chart shown on the opposite page. The unique horizontal viewing angles (0, 22.5, 45, 67.5, 90) are charted across the top as the column headings. The viewing angles, staggered in 5-degree increments between 0 and 90 degrees, are the row headings. The various candela measurements taken along the vertical plane at each unique horizontal position are contained within the chart.
Commercial fixtures today commonly distribute light in either a spherical pattern or a batwing pattern. A spherical pattern of light resembles a ball stuck to the fixture and the batwing pattern of light resembles a bat, with wings spread, going headfirst into the fixture. It is by plotting the information captured on the candela chart into a candela distribution curve that the pattern of light emitted by the fixture is realized.
|
The candela distribution curve illustrates
that this fixture distributes light in a batwing pattern.
Image courtesy of Prudential Lighting |
The Candela Distribution Curve
The measurements from the candela chart are plotted onto a polar graph to create a candela distribution curve. The candela distribution curve graphically illustrates the lighting distribution pattern of the fixture. This circular (or semi-circular) graph places the light source at the center and maps the various light intensities (in candelas) in incremental steps up the vertical plane (0-180 degrees) for a single horizontal viewing angle. The plots for multiple horizontal viewing angles can be laid over one another onto one distribution curve to better illustrate changes in the direction and intensity of light output that a person would experience as they walked around the fixture from one horizontal viewing angle to another.
Look at the candela distribution curve shown at left. This one polar graph contains three vertical viewing planes taken from three horizontal viewing positions (0, 45, and 90 degrees). Notice that the graph illustrating the vertical viewing plane at 90 degrees has a distinct batwing shape.
A Few Quick-Read Characteristics
There are a few important characteristics about the lighting fixture and how the lighting fixture will perform in a space that are quickly revealed by referencing the candela distribution curve. It can be an easy way to compare the lighting distribution of multiple fixtures of interest. First, the distribution curve will illustrate if the fixture is direct (emits light only between 0 and 90 degrees on a vertical axis), indirect (emits light only between 90 and 180 degrees on a vertical axis), or direct/indirect which emits light both above and below the fixture (0 to 180 degrees on the vertical plane).
The distribution curve also reveals if the fixture distributes light in a focused spotlight pattern or a wider flood pattern. A fixture with a focused or spot distribution will have a relatively narrow distribution curve with light remaining either above or below the light source in the center of the graph, whereas a medium or wide floodlight will have an increasingly wider distribution pattern.
The shape of the distribution pattern can communicate differences in how the different fixtures will perform in the space. When comparing fixtures that emit light in a batwing pattern and fixtures that emit light in a spherical pattern, the batwing pattern provides a relatively wider distribution of light and blankets a working plane with fairly even levels of illumination. Spherical patterns can create less even illumination, and in some cases even lighting deficiencies, at the working plane.
Performance issues that a fixture may have, such as disruptions in the distribution pattern or a propensity to create glare, can also be deduced by reviewing the distribution curve. A smooth and rounded candela distribution curve indicates that the light fixture will produce a smooth light pattern, whereas striations in the distribution pattern indicate that the fixture may cause inconsistent illumination and streaking in the space. The candela distribution curve can also reveal if a fixture is likely to produce glare. Fixtures that emit high-intensity light (300+ candelas) in the vertical viewing angle range of 65 to 90 degrees are considered at higher risk for creating glare in a space.
It is important to note that each candela chart and candela distribution curve is generated to reflect the performance of a specific fixture and lamp combination. Making changes to the lamp, fixture, or aspects of the fixture can materially alter the candela chart and candela distribution curve of the fixture.
The data found on a candela chart can be entered into lighting design software for a more detailed analysis of the distribution pattern and to identify potential performance issues. Many manufacturers make this information readily available for their specification-grade fixtures. These files are typically produced in the standard format created by the Illuminating Engineering Society (IES) and are often referred to as IES files.
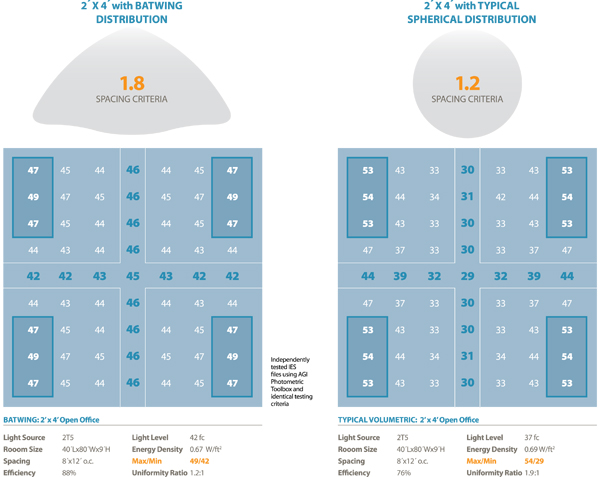 |
A fixture that distributes light in a batwing pattern can spread light more evenly at the work surface than a fixture that distributes light in a more
spherical pattern.
Image courtesy of Prudential Lighting |
Energy Efficiency and Good Commercial Lighting
Commercial lighting consumes a lot of energy. In fact, the Buildings Energy Data Book, published by the United States Department of Energy concluded that, in 2010, lighting was the largest energy consumer in commercial buildings, consuming over 20 percent of the 18.26 quadrillion Btu used by commercial buildings in the United States that year. That is more than any other recorded end-use, including: heating, cooling, ventilation and refrigeration.
In an attempt to limit the growth of the largest energy consumer in the commercial environment, building energy codes specifically address the amount of energy that a lighting system can consume in a commercial building. Designs must satisfy energy codes as a condition for approval to construct and occupy buildings in the United States.
The building energy standard written by the American Society of Heating, Refrigerating and Air-Conditioning Engineers (ASHRAE), referred to as the ASHRAE 90.1 standard (ASHRAE 90.1), is one standard with which compliance is mandatory. ASHRAE 90.1 limits the amount of lighting power that can be used in a commercial building by defining an allowable amount of installed lighting power (in watts) per area of floor space (in square feet). This W/f2 metric is referred to as the lighting power density (LPD).
Allowable LPD varies by building and space type. For example, in ASHRAE 90.1-2010, office buildings are allowed 0.9 W/f2, schools are allowed 0.99 W/f2, and a museum is allowed 1.06 W/f2.
In developing functional commercial spaces, specifiers are seeking fixtures that deliver the IESNA-recommended light intensity at the working level and can be configured into a layout that is compliant with ASHRAE 90.1 LPD limits. The optical system in a fixture determines the distribution pattern and placement of light. The type of lamp and the efficiency of the fixture determine the amount of energy necessary to generate those precious footcandles on the work plane.
Efficacy and Lamp Life of Commercial Lamp Types
At its most basic, the efficiency of a lighting system is determined by the efficiency of the lamp and the efficiency of the lighting fixture. When discussing the efficiency of a lamp, the term efficacy is often used. Lamp efficacy refers to the number of lumens, or amount of light, that a specific lamp type produces per watt of energy it consumes. This lumens per watt metric, often abbreviated into LPW, can be significantly different from one lamp type to the next. A higher lamp efficacy denotes that a greater amount of light is being produced per unit of energy consumed, indicating a more efficient lamp type.
In addition to lamp efficacy, lamp life should be considered when determining the total footprint that a light source leaves on a project. Rated lamp life describes the number of illuminated hours that one lamp is expected to last before needing to be replaced. Selecting a lamp type with a longer rated life will minimize the necessary maintenance and the material lamp waste created by the lighting system.
Taking a closer look at the many lamp types commonly found in commercial applications, including, linear fluorescent, compact fluorescent, halogen, high-intensity discharge (HID) and light emitting diodes (LEDs), reveals that there is significant variation in the efficacy and lamp life offered from one lamp type to the next. Identifying the lamp type that best meets the energy performance needs of the project is an important step in specifying good lighting.
Fixture Efficiency
Fixture efficiency describes the percentage of the total lamp lumens produced by the lamp inside the fixture that are then emitted by the fixture into the interior space. A naked lamp, with no fixture housing around it, is 100% efficient, because all of the light produced by the lamp is delivered into the environment.
Fixture efficiency is not an indicator of the quality of the light provided or the visual comfort produced by the luminaire. A naked lamp, for example, although efficient, would wreak havoc on the visual environment. The naked lamp would cause a glaring hot spot in the space and without any way to focus the light onto the work level, much of the light would be wasted illuminating the ceiling, corners, and other unusable places. It is an important note that a more efficient fixture does not necessarily provide more usable light.
 |
Fixture efficiency is not an indicator of the quality of light produced or the visual comfort provided by the luminaire.
Photo courtesy of Prudential Lighting |
The importance of fixture efficiency, and its impact on the visual environment and the efficiency of the space, is often misunderstood when different fixtures are being evaluated. In the process of selecting a fixture for a commercial space, fixture efficiency should be a secondary or tertiary consideration. Once the visual tasks that will performed in the space have been addressed, and the IESNA-recommended light levels and location have been reviewed, and a lamp type that can produce the necessary lumens and meets the energy performance needs of the project has been identified, a specifier will start searching for the right fixture.
 |
When comparing lighting fixtures, higher SC ratings can save money by reducing the total number of fixtures required to illuminate a space.
Image courtesy of Prudential Lighting |
If a fixture meets the LPD requirements of the setting, but cannot produce the recommended light level on the work plane, perhaps a more efficient fixture, with the same LPD, would be able to eke out enough additional lumens to bridge the gap. However, emitting more lumens, being a more efficient fixture, does not guarantee that the light levels at the work plane will increase, it simply means that overall, somewhere in the surrounding space, more light will be available.
If a fixture produces the right amount of light in the right spots, but has exceeded the LPD requirements for the space, selecting a more efficient fixture, with the same distribution pattern, may very well enable the design to provide the desired light with less energy.
Interestingly enough, selecting a fixture with a more advanced optical system can offer an additional benefit that will aid specifiers in meeting the ASHRAE 90.1 LPD requirements and, as previously discussed, can provide better, more controlled light distribution.
Spacing Criteria of Commercial Lighting Fixtures
The fixture spacing criteria (SC) rating, also referred to as the spacing-to-mounting height ratio, identifies the maximum fixture spacing that can exist, from one fixture to the next, while still providing reasonably even illumination at the work plane. This is a key metric that should be considered when selecting and laying out the fixtures in the space, because the SC rating can make a significant impact on the total energy footprint of the lighting system and can help a space meet the LPD requirements specified by ASHRAE 90.1.
To determine the ideal fixture spacing, simply multiply the SC rating by the distance between the fixture mounting height and the target working level. For example, a fixture with an SC rating of 1.4 is being considered for a space. The fixture will be mounted on a 9 foot high ceiling and the work plane is a desk that is 30 inches off of the ground (2.5 feet). The difference between where the fixture is mounted and the desk surface is 6.5 feet. Multiply the SC rating of 1.4 by 6.5 to determine that the fixtures can be spaced 9.1 feet apart, center to center, to maintain even working level illumination.
Fixtures with stronger optical systems can boost SC ratings from the fairly common 1.2 or 1.4 to an impressive 1.8. With a 1.8 SC ratio, the fixtures in the office scenario just described could be placed 11.7 feet apart, instead of 9.1 feet apart, dramatically reducing the number of fixtures that must be specified to evenly illuminate a space.
The SC rating of a fixture has implications on the project's ability to meet or exceed the ASHRAE 90.1 LPD requirements. Fixtures with larger SC ratings can be spaced further apart and illuminate more space with less wattage giving specifiers additional assistance for satisfying the ever-shrinking watts per square foot requirements.
Illuminating more space with fewer fixtures also saves money, because fewer fixtures will be required to provide optimum lighting levels, reducing material costs. Maintenance costs will also be reduced over the life of the building, because there are fewer fixtures to maintain.
The definition of good lighting may not have changed over the years. It still means that the lighting levels are appropriate to support the visual tasks that will be performed, that the visual environment is comfortable and evenly illuminated, and that the lighting is provided with an ever-shrinking energy footprint. In fact, it could be argued that the most significant change to good lighting over the last few years is that, with the development of advanced optical systems, it is becoming increasingly more possible for a specifier to provide it.
 |
Manufacturing in Los Angeles since 1955, Prudential Lighting continues to create a wide range of fixtures, from elegant
pendants to innovative LED luminaires, while collaborating with designers in realizing their visions for architectural lighting
environments. Light creates life. Create with Prudential Ltg. www.prulite.com |