This CE Center article is no longer eligible for receiving credits.
Barcelona’s ability to try out an urban-design concept in limited areas of the city before rolling it out at full scale is, from Singapore’s perspective, something of a luxury. “Singapore is a city-state, and there’s rarely the room for us to experiment with our plans,” according to Siau Yong Ng, director of the Singapore Land Authority’s geospatial division. So, in a global first, the city is synthesizing all of the 3-D efforts of its various government agencies, along with vast stores of associated data from existing geospatial and other platforms, to create a digital twin of the entire city.
The $54 million project, scheduled for phased deployment beginning this year, will provide a single, authoritative digital platform for government and private-sector users, as well as researchers and the public, to better understand the city and to explore ways to improve it. Users will be able to pretest concepts and services that range from energy
and food production to mobility, from development proposals to long-term land-use planning.
Astonishingly detailed for such an enormous construct, the platform’s semantic 3-D modeling provides information on terrain attributes, transportation infrastructure, and buildings and their geometry and components, right down to floorplans and materials composition. Multiple sources of static, dynamic, and real-time city data, including information from government agencies, the internet, and Internet of Things devices, enrich the platform with demographics, traffic, and weather. According to a statement from Singapore’s National Research Foundation (NRF), which led the development of the model, “the potential uses of Virtual Singapore in tackling livability issues are limitless.”
For the city’s designers, planners, and decision-makers, the platform allows sharing and reviewing project documentation in context, and to conduct more meaningful public consultations. In turn, this enhanced contextualization and collaboration also allow for a more integrated consideration of how proposed changes will affect the public realm.
For example, planners can simulate the effect of proposed green roofs on temperature and light intensity in the surrounding area, overlay heat and noise maps on existing and proposed developments, or model a building’s influence on wind flows in the street. With slopes, steps, and curbs modeled, it will be possible to visualize universally accessible routes. The platform will also allow users to filter buildings based on pre-set parameters: apartment blocks suitable for solar panels under the country’s Greenprint initiative could be quickly identified by number of stories and roof type.
From their own experience with building information modeling, architects may already be familiar with many of these capabilities, but to bring them together in a project of Virtual Singapore’s scope and scale offers to revolutionize the way cities understand themselves. Concentrating so much information in one, publicly accessible platform, however, is also raising unprecedented issues of privacy and security. “This information will help our daily lives, but it could also fall in the wrong hands and create problems for Singapore,” George Loh, the NRF’s director of programs, told Reuters. “We need to think about that. We need to be two or three steps ahead.”
A newer entrant in the smart-city stakes, Los Angeles, is also using big data to understand risks and opportunities. Projects that address two prominent L.A. priorities include an artificial intelligence-enabled disaster preparation and management program, and a mapping-based community-development initiative.
According to the United States Geological Survey (USGS), odds are that a magnitude 6.7 earthquake will hit Los Angeles in the next 30 years (with lower, but still considerable, odds for a quake of greater magnitude). As part of its efforts to mitigate the impacts of such a disaster, the L.A. Emergency Management Department (EMD) is testing a software platform that incorporates data on hundreds of attributes for three key vectors: the natural environment (from such sources as topographical maps, soil surveys, and USGS seismic sensors); the built environment (building code and permit documentation, zoning maps, satellite imagery); and demographics (from the U.S. Census Bureau). The software combines these data to run simulations of, say, the thousand most likely earthquakes—or particular quakes of defined magnitude, depth, and location—and applies machine learning and predictive analytics to forecast impacts at the census-block level. In the event of an actual disaster, it would provide near real-time information on where and what types of damage to expect and what populations were likely to be affected.
IMAGES: © NATIONAL RESEARCH FOUNDATION SINGAPORE, SINGAPORE LAND AUTHORITY, GOVERNMENT TECHNOLOGY AGENCY OF SINGAPORE, DASSAULT SYSTÈMES
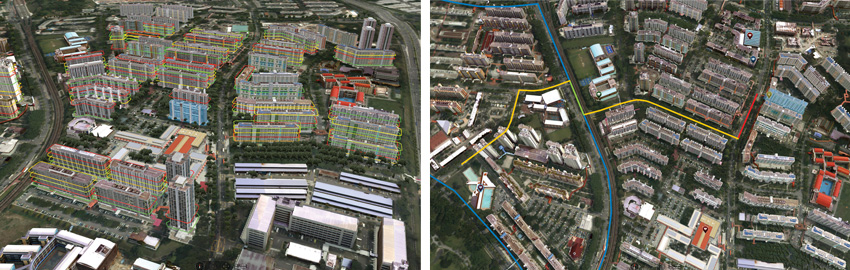
Virtual Singapore, a synthesis of the digital models of various government agencies and vast stores of data, can be put to a wide variety of uses, including producing a visual display of apartment resale values (left), or helping bicycle commuters map the best route between two points (right).
“Which buildings are going to collapse and block emergency routes, so we can prioritize upgrading them? Which major highways in the supply chain are going to collapse, and which will survive, so I can designate them as alternates?” These are some of the questions Aram Sahakian, EMD’s general manager, hopes the software can help with. He is planning to run a simulation in a public-private partnership with several grocery distribution centers located on the San Andreas Fault. Since they are a critical part of the city’s infrastructure, Sahakian wants them up and running three to four weeks after a major quake. He’s hoping that the data-based predictions will motivate the companies to start planning for resilience. “As businesses, it’s in their interest too,” he says. About a year into the trial, it’s too early for Sahakian to judge how useful the software will be, but it’s promising, he says.
While the EMD uses data to prepare for the worst, RegenCities, a 2018 American Planning Association Smart Cities Award–winning research initiative by SOM, aims for the best. RegenCities draws on an SOM-developed, systems-based methodology, which the firm calls “health topography.” It uses geo-referenced information to analyze a city’s vital signs. A scan of public data from open-source portals is combined with census-tract data for a defined area, and categorized according to five urban systems: built, natural, infrastructure, socioeconomic, and cultural. The data are then aggregated, mapped, and cross-referenced against 10 principles, or traits, of regenerative cities (such as energy, economy, and mobility) to reveal areas of abundance and scarcity. The data sets themselves are not intended to be conclusive, says Gunnar Hand, leader of SOM’s city-design practice. Instead, they help to focus discussion among the people involved.
Beginning with a health-topography assessment conducted for South L.A., SOM partnered with local businesses, nonprofit organizations and community leaders, and the Los Angeles mayor’s office to found a community development initiative called RemakeLA. Returning to data, this time for property ownership, RemakeLA identified and mapped about 5,000 municipally owned surplus sites (property severed during a road construction, for example, and left to deteriorate into a weedy nuisance). It then developed an online geohub to open a public conversation about these sites’ potential for community-based economic development, entrepreneurship, and reinvestment.
IMAGES: © SOM
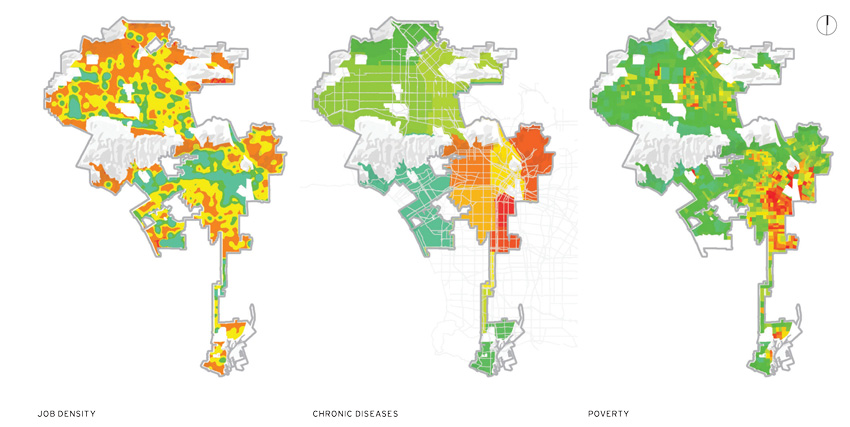
SOM’s Los Angeles research project RegenCities collects data from open-source portals, combining them with census-tract data. Deploying a systems-based methodology to understand vulnerabilities and opportunities, it analyzes this information across several indicators, including those for public health and socioeconomic standing.
As a result, SOM is now collaborating with the architecture program at Los Angeles Trade Technical College, whose students come predominantly from South Los Angeles, to develop a pilot program for one of the sites. Participants will use the geohub to identify a parcel suitable for locating an open architecture studio—a base for community-student architectural collaborations. If approved, the facility will be designed and built by students in the college’s programs. One primary goal for the pilot “is to prove to the mayor’s office that permitting use of these parcels could be a valuable tool in their economic-development box—empowering the public,” says Hand.
Responding to the particular circumstances and priorities of their home place, these examples of how cities are using technology to understand and improve themselves vary wildly. Yet they share a common theme: the integration of data to craft a comprehensive strategy. “We need a holistic approach to cities,” says Rueda, “because our main subject is humanity.”
Katharine Logan is an architectural designer and writer focusing on design, sustainability, and well-being.
View course on architecturalrecord.com »
Despite the buzz around a few hyperconnected cities and districts being planned and built as urban utopias from the ground up—such as Portugal’s PlanIT Valley, Toronto’s Quayside district, Qatar’s Lusail, and South Korea’s Songdo—the real potential for technology to boost the quality of life lies in existing cities, where most people already live.
IMAGES: © BCN ECOLOGIA
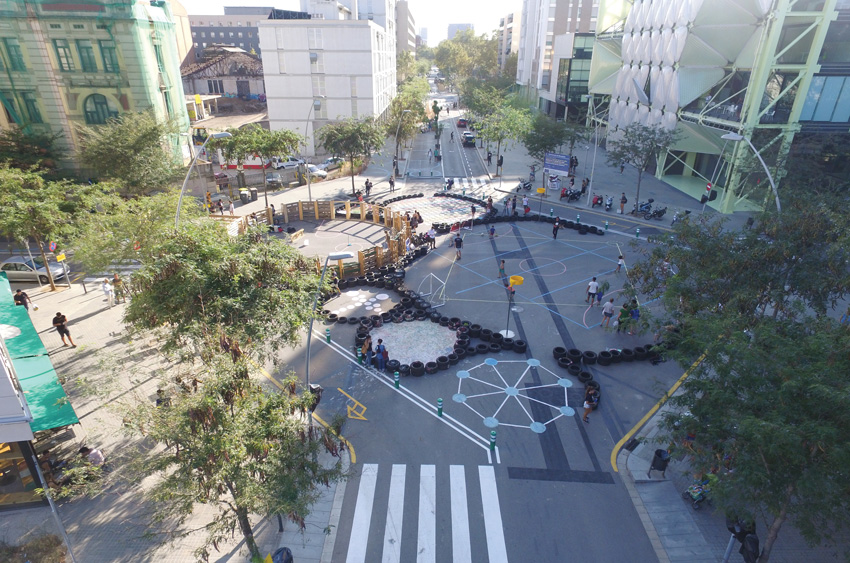
Barcelona is implementing a superblock initiative that is freeing up space previously dominated by cars for other uses.
“The spaces around us are becoming permeated with the Internet of Things, a fusion of bits and atoms,” says architect Carlo Ratti, director of the Senseable City Lab, a multidisciplinary research initiative at the Massachusetts Institute of Technology. “Its manifestations are everywhere. From energy to waste management, mobility to water distribution, city planning to citizen engagement, digital technology is facilitating novel interactions with urban space.” In New York, sidewalk kiosks on former pay phone sites provide access to public Wi-Fi and city services, while in Moscow, an intelligent transport system tackles the city’s near-critical congestion. Connected water infrastructure in Christ church, New Zealand, helped prioritize repairs following a major earthquake; air-quality sensors inform Beijing’s regulation of construction and traffic; and real-time consumption data facilitates distributed energy initiatives in Copenhagen. Around the world, to varying degrees, existing municipalities are retrofitting with new technology in pursuit of familiar priorities, in combinations tailored to each city’s particular circumstances.
IMAGES: © BCN ECOLOGIA
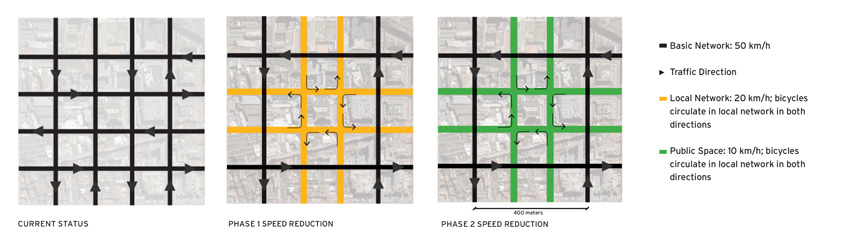
Within each nine-block precinct, no through traffic is permitted and speeds are reduced. To facilitate the transition, speed limits drop in two phases.
But it’s not the technology per se that’s having the impact. It’s not even the data that the tech generates. The significance of “smart” technology comes from how people use the data to inform decisions about their city.
“Smart city” is a catch-all for the use of information and communications technology (ICT) to improve a city’s operations and its citizens’ quality of life. The term lacks consistent usage, even among experts, who generally don’t like it, preferring alternatives with more inherent meaning, such as “connected,” “sensing,” or even the neologism “senseable,” which, says Ratti, implies both “able to sense” and “sensible.” Whatever they want to call it, some cities are crafting a more livable urban fabric, particularly two municipalities perennially acknowledged to be among the world’s most connected, Barcelona and Singapore. Another showing potential to use this data this way is Los Angeles.
Barcelona’s development of its technological infrastructure stretches back about 30 years, and now encompasses more than 40 programs. One of the most transformative may be the city’s “superblocks,” an initiative being instituted in existing neighborhoods in response to increasingly congested streets and associated noise and pollution levels.
Not to be confused with the disconnected, monolithic superblocks that Jane Jacobs effectively discredited, each Barcelona superblock comprises a three-by-three, nine-block neighborhood of traffic-calmed and shared streets. Local traffic can enter only along the center block of each side, drive slowly around that block, and reemerge on the street from which it entered, which limits through-traffic to the perimeter. Within the block, the scheme liberates more than 70 percent of the surface previously occupied by cars, reducing noise, improving air quality, and providing much-needed public space.
The clustering of blocks, exclusion of traffic, and installation of picnic tables, play areas, and potted trees may seem like an analog initiative, but it rests on “data-integrated decision-making,” says Salvador Rueda, director of the Agència d’Ecologia Urbana de Barcelona (BCN Ecologia) and originator of the superblock program. Rueda first proposed the superblock concept in 1987 (even then, noise and poor air quality were marring city life), but a lack of reliable projections about traffic impacts stalled it. Now, with contemporary sensing and simulation technologies, says Rueda, “we can use data to advocate, to plan, and to verify.”
For example, increasingly sophisticated monitoring equipment has enabled the creation of a network of fixed and
moving sensors that connect with ICTs and a cloud-computing process. These make it possible to assess a range of air-quality parameters—particulates, nitrogen dioxide, and other pollutants—and to generate accurate, real-time estimates of doses inhaled daily by residents and commuters. Similarly, traffic flow is measured with sensors (mainly cameras) positioned in intersections, superblock access roads, and calmed streets.
Variables analyzed through data-based simulations and subsequent verifications (conducted by validating simulation results with on-street measurements and other local data) include traffic, public transport, and cycle routes; beyond mobility, they include environmental impacts such as air quality, noise, thermal comfort in public space, green surface and soil permeability, greenhouse-gas production, and biodiversity. It even quantifies more nuanced factors, such as social cohesiveness, which is measured by assessing diversity of income, culture, and age among people living in a superblock, as well as the provision and spatial distribution of social housing and urban amenities. Using comparative risk assessment and other standard methodologies, Rueda’s team can estimate preventable premature mortality, gains in life expectancy, and economic impacts related to the superblocks. “A scientific approach based on data allows decision-makers to understand what the improvements will be if they implement the idea,” says Rueda.
To date, five superblocks have been implemented, three are in development, and three more were announced in April. (Insufficient community consultation resulted in opposition to one of the projects, but that subsided as the benefits—especially the new social spaces—became clear. Now the superblocks’ popularity is raising concerns about gentrification.) The city’s transit system has been overhauled from radial to orthogonal routes that coordinate with the superblock grid.
If realized as envisioned in Barcelona’s Sustainable Urban Mobility Plan 2013–2018, there will eventually be 503 superblocks city-wide.
IMAGES: © BCN ECOLOGIA
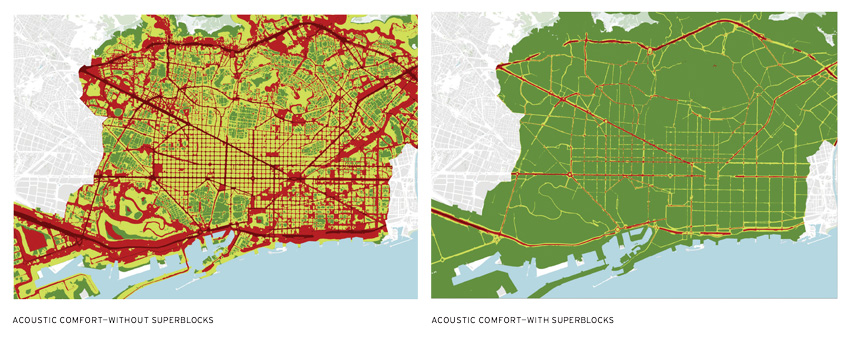
If realized as envisioned in Barcelona’s mobility plan, the superblocks are projected to reduce traffic and bring about a host of associated benefits, including shortened waits for public transit, enhanced safety, improved air quality, and noise-pollution reductions (above, left and right), with red indicating zones with high noise levels.
The scheme is projected to achieve a 21 percent reduction in overall traffic, which will shorten trip times and improve safety, reduce the wait for public transit to an average of two minutes, bring air pollution levels citywide within recommended values (currently over 40 percent of residents live with excessive pollution), allow for increased social connectivity and green space, and prevent an estimated 670 pollution-related premature deaths annually. “The reduction of impacts and the improvement of the quality of life is huge,” says Rueda.
Barcelona’s ability to try out an urban-design concept in limited areas of the city before rolling it out at full scale is, from Singapore’s perspective, something of a luxury. “Singapore is a city-state, and there’s rarely the room for us to experiment with our plans,” according to Siau Yong Ng, director of the Singapore Land Authority’s geospatial division. So, in a global first, the city is synthesizing all of the 3-D efforts of its various government agencies, along with vast stores of associated data from existing geospatial and other platforms, to create a digital twin of the entire city.
The $54 million project, scheduled for phased deployment beginning this year, will provide a single, authoritative digital platform for government and private-sector users, as well as researchers and the public, to better understand the city and to explore ways to improve it. Users will be able to pretest concepts and services that range from energy
and food production to mobility, from development proposals to long-term land-use planning.
Astonishingly detailed for such an enormous construct, the platform’s semantic 3-D modeling provides information on terrain attributes, transportation infrastructure, and buildings and their geometry and components, right down to floorplans and materials composition. Multiple sources of static, dynamic, and real-time city data, including information from government agencies, the internet, and Internet of Things devices, enrich the platform with demographics, traffic, and weather. According to a statement from Singapore’s National Research Foundation (NRF), which led the development of the model, “the potential uses of Virtual Singapore in tackling livability issues are limitless.”
For the city’s designers, planners, and decision-makers, the platform allows sharing and reviewing project documentation in context, and to conduct more meaningful public consultations. In turn, this enhanced contextualization and collaboration also allow for a more integrated consideration of how proposed changes will affect the public realm.
For example, planners can simulate the effect of proposed green roofs on temperature and light intensity in the surrounding area, overlay heat and noise maps on existing and proposed developments, or model a building’s influence on wind flows in the street. With slopes, steps, and curbs modeled, it will be possible to visualize universally accessible routes. The platform will also allow users to filter buildings based on pre-set parameters: apartment blocks suitable for solar panels under the country’s Greenprint initiative could be quickly identified by number of stories and roof type.
From their own experience with building information modeling, architects may already be familiar with many of these capabilities, but to bring them together in a project of Virtual Singapore’s scope and scale offers to revolutionize the way cities understand themselves. Concentrating so much information in one, publicly accessible platform, however, is also raising unprecedented issues of privacy and security. “This information will help our daily lives, but it could also fall in the wrong hands and create problems for Singapore,” George Loh, the NRF’s director of programs, told Reuters. “We need to think about that. We need to be two or three steps ahead.”
A newer entrant in the smart-city stakes, Los Angeles, is also using big data to understand risks and opportunities. Projects that address two prominent L.A. priorities include an artificial intelligence-enabled disaster preparation and management program, and a mapping-based community-development initiative.
According to the United States Geological Survey (USGS), odds are that a magnitude 6.7 earthquake will hit Los Angeles in the next 30 years (with lower, but still considerable, odds for a quake of greater magnitude). As part of its efforts to mitigate the impacts of such a disaster, the L.A. Emergency Management Department (EMD) is testing a software platform that incorporates data on hundreds of attributes for three key vectors: the natural environment (from such sources as topographical maps, soil surveys, and USGS seismic sensors); the built environment (building code and permit documentation, zoning maps, satellite imagery); and demographics (from the U.S. Census Bureau). The software combines these data to run simulations of, say, the thousand most likely earthquakes—or particular quakes of defined magnitude, depth, and location—and applies machine learning and predictive analytics to forecast impacts at the census-block level. In the event of an actual disaster, it would provide near real-time information on where and what types of damage to expect and what populations were likely to be affected.
IMAGES: © NATIONAL RESEARCH FOUNDATION SINGAPORE, SINGAPORE LAND AUTHORITY, GOVERNMENT TECHNOLOGY AGENCY OF SINGAPORE, DASSAULT SYSTÈMES
Virtual Singapore, a synthesis of the digital models of various government agencies and vast stores of data, can be put to a wide variety of uses, including producing a visual display of apartment resale values (left), or helping bicycle commuters map the best route between two points (right).
“Which buildings are going to collapse and block emergency routes, so we can prioritize upgrading them? Which major highways in the supply chain are going to collapse, and which will survive, so I can designate them as alternates?” These are some of the questions Aram Sahakian, EMD’s general manager, hopes the software can help with. He is planning to run a simulation in a public-private partnership with several grocery distribution centers located on the San Andreas Fault. Since they are a critical part of the city’s infrastructure, Sahakian wants them up and running three to four weeks after a major quake. He’s hoping that the data-based predictions will motivate the companies to start planning for resilience. “As businesses, it’s in their interest too,” he says. About a year into the trial, it’s too early for Sahakian to judge how useful the software will be, but it’s promising, he says.
While the EMD uses data to prepare for the worst, RegenCities, a 2018 American Planning Association Smart Cities Award–winning research initiative by SOM, aims for the best. RegenCities draws on an SOM-developed, systems-based methodology, which the firm calls “health topography.” It uses geo-referenced information to analyze a city’s vital signs. A scan of public data from open-source portals is combined with census-tract data for a defined area, and categorized according to five urban systems: built, natural, infrastructure, socioeconomic, and cultural. The data are then aggregated, mapped, and cross-referenced against 10 principles, or traits, of regenerative cities (such as energy, economy, and mobility) to reveal areas of abundance and scarcity. The data sets themselves are not intended to be conclusive, says Gunnar Hand, leader of SOM’s city-design practice. Instead, they help to focus discussion among the people involved.
Beginning with a health-topography assessment conducted for South L.A., SOM partnered with local businesses, nonprofit organizations and community leaders, and the Los Angeles mayor’s office to found a community development initiative called RemakeLA. Returning to data, this time for property ownership, RemakeLA identified and mapped about 5,000 municipally owned surplus sites (property severed during a road construction, for example, and left to deteriorate into a weedy nuisance). It then developed an online geohub to open a public conversation about these sites’ potential for community-based economic development, entrepreneurship, and reinvestment.
IMAGES: © SOM
SOM’s Los Angeles research project RegenCities collects data from open-source portals, combining them with census-tract data. Deploying a systems-based methodology to understand vulnerabilities and opportunities, it analyzes this information across several indicators, including those for public health and socioeconomic standing.
As a result, SOM is now collaborating with the architecture program at Los Angeles Trade Technical College, whose students come predominantly from South Los Angeles, to develop a pilot program for one of the sites. Participants will use the geohub to identify a parcel suitable for locating an open architecture studio—a base for community-student architectural collaborations. If approved, the facility will be designed and built by students in the college’s programs. One primary goal for the pilot “is to prove to the mayor’s office that permitting use of these parcels could be a valuable tool in their economic-development box—empowering the public,” says Hand.
Responding to the particular circumstances and priorities of their home place, these examples of how cities are using technology to understand and improve themselves vary wildly. Yet they share a common theme: the integration of data to craft a comprehensive strategy. “We need a holistic approach to cities,” says Rueda, “because our main subject is humanity.”
Katharine Logan is an architectural designer and writer focusing on design, sustainability, and well-being.