This CE Center article is no longer eligible for receiving credits.
Architects, engineers, and other design professionals often find themselves in the position of needing to successfully (i.e., profitably) manage projects, or a portion of a firm, or even the entire firm. Others see the potential in starting their own firm but struggle with the uncertainties of how to do it and make money at it. In many of these situations, the most common mantra heard is “we never learned how to do this in school!” This course is intended to help fill some of that gap in education. It covers some basic concepts of managing a practice from a business and profitability perspective. It also focuses on the key data that every manager needs to track, monitor, and act upon in order to not just remain solvent, but to thrive.

All photos courtesy of BQE Software
The financial health of a firm is directly related to the financial health of projects–and the ability to successfully manage relevant data.
WHAT MAKES FOR A FINANCIALLY HEALTHY FIRM?
The basic business premise of any firm that provides professional design services (i.e., architecture, engineering, landscape architecture, surveying, etc.) is to enter into an agreement with a client for one or more specific projects. In exchange for providing the project design services, the client agrees to pay for those services in the amount and timeframe agreed upon. As long as each side does it’ spart, then both the client and the design professional are fundamentally satisfied.
While all of this sounds simple, the reality is that most firms are engaged concurrently with multiple clients, multiple projects, and multiple people working on them. Keeping track of all that activity can be challenging unto itself. Doing it all so that the firm remains profitable requires paying attention to the financial and business aspects of a firm. Without bringing adequate money into the firm each month, employee payroll can’t be met, overhead payments can’t be paid, and business debt may become an undue burden. Those things create an economically unhealthy firm.
On the other hand, a healthy firm manages the different variables such that the billable work completed each month generates enough fees to meet or exceed all the expenses. The usual way to achieve that is to first focus on the management of the individual projects. Fundamentally, if projects are being managed to stay within the budget of “direct project costs” (labor, consultants, etc.) and the project time schedule, then they should be generally profitable. If a firm is consistent at managing projects profitably, then the business should be profitable overall, if there aren’t undue non-project costs that are being carried by the firm. Hence, keeping other overhead, financing, or “indirect” costs under control is important, too.
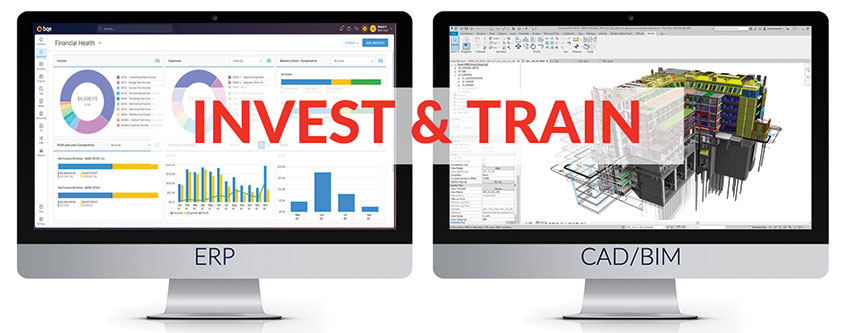
Most design firms of any size wouldn’t think about doing design work without the use of CAD or BIM because of the superior results they provide. The same is true with effective management software which can streamline and simplify many administrative tasks while producing information that is invaluable to better decision-making.
The Basic Metric: Time
The most common basis for determining the cost of providing professional services is the time spent on each project. Profit or loss is often determined by whether all the time spent on a project can be billed to the client, or not. In this regard, there are a few fundamental points to keep in mind:
Time spent on project work is referred to as “direct hours”–i.e., time charged directly to a project. This means that employees need to track their time, which is commonly done on a paper or electronic time sheet. The recording of time spent is important whether the employee is paid hourly or if the employee’s salary is allocated proportionately to a project with an hourly rate equivalent.
Project team members who are well-managed and efficient with their time can complete projects within a budgeted time schedule and then move on to another–hence generating fees to cover, or exceed, the cost of producing the work.
Spending more time than can be legitimately billed to the client causes a drain on cash flow and profitability of the firm.
It is important to recognize that employees need to spend time on things other than project work such as administrative work, paid time off, training, or other purposes. This is referred to as “indirect time” that needs to be accounted for and absorbed by the firm since the employees still get paid regardless of how their time is spent.
In addition to personnel costs (i.e., salary, benefits, taxes), a firm usually has some level of overhead costs to cover, too. These can include things like office rent, utilities, supplies, computer equipment, software, etc. Most of these are fairly stable or “fixed” costs from month to month. As such, they can be allocated across projects or as part of a multiplier of employee time.
Based on these realities, the best way to monitor the financial health of a firm is to track the time and associated costs of the people working in the firm. Tracking the time spent on projects compared to the time spent on other things is important at both the project level and the firm level. Relatedly, understanding other costs and allocating them properly as part of project costs reveal the true profitability of projects. Having the right data that is up-to-date and current, managers can analyze it to see trends, identify problems, compare projects, make adjustments during a project, and determine whether to pursue more work with a particular client or not.
Currently, the fastest and most efficient way to collect and analyze this data is to use readily available software designed specifically for professional design firms. Using such management software is comparable to using design software (e.g., CADD, BIM) for efficient, quality design and documentation results. This is true whether the firm is a sole proprietorship, a small partnership, a mid-sized office, or a large multi-office organization.
WHAT ARE KPIs AND WHY DO THEY MATTER?
Recognizing the importance of data within a firm is the first step to running a financially healthy firm. It has been commonly said that “You can’t manage what you don’t measure.” However, to be truly useful, the data needs to be relevant to the things that make a difference in the profitability of the firm. They also need to be distinct enough not only to provide information, but to enable actionable intervention when needed. The term used for such data are “key performance indicators” or simply KPIs.
In the largest sense, KPIs track success or challenges by measuring financial performance within a firm. They can be applied firmwide or focus on specific projects, particular teams, project types, or even the performance of working with specific clients. Of course, since each firm has different goals and ways of working, the most important KPIs can vary between firms and even from project to project.
Regardless of variables within firms or projects, effective KPIs have some common characteristics. First, they need to be well-defined and readily quantifiable. Clear decision making starts with clearly understanding what the data represents and how it is measured. Second, KPIs need to measure performance over time. Different periods of time may show different results and trends over time can show where the firm is heading. Third, the relevant information should be effectively and thoroughly communicated to every employee. If everyone understands the metrics being tracked in KPIs, it is easier for everyone to move toward better outcomes for the success of the firm.
KPIs are used in many types of businesses, and they are fully applicable to professional practice firms as well. They provide crucial measurements for tracking the progress of the business goals and objectives of the firm. Notably, within the world of project performance and finance, there are certain KPIs which should always be used to monitor and improve success. Hence, in the following sections, we take a deeper look at 11 of the most common KPIs. All of these can be used to help manage projects, firms, or client relationships.
KPI #1 – UTILIZATION
Determining the utilization rate of employees in a firm is a fundamental measurement that has powerful effects on how a business is run. It is defined as the amount of an employee's available time that's used for productive, billable work, (i.e., direct project work). It is always expressed as a percentage of the total available time, such that a utilization rate of 100 percent means that all hours are billable, and zero percent means that no hours are billed to a client.
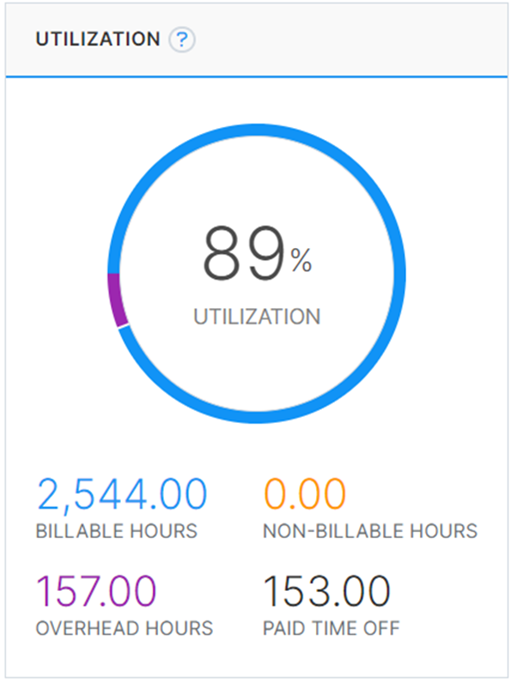
Utilization is defined as the amount of an employee's available time that's used for productive, billable work, expressed as a percentage.
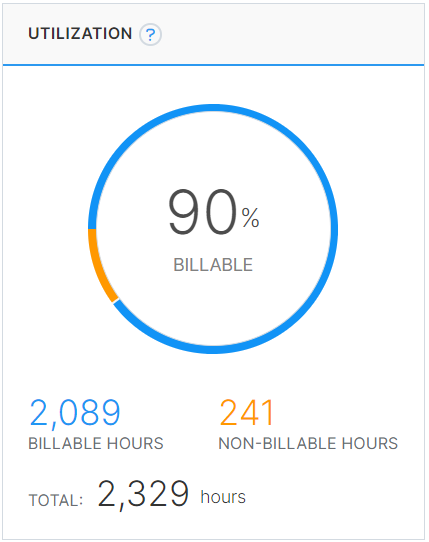
The first way to look at utilization is to apply it to individual employees. If we assume a 40-hour work week and look at it for 52 weeks, then the total annual available time for an employee can be presumed to be 2,544 hours. Most firms offer paid time off (PTO) such as vacation, holidays, sick time, etc. which is obviously not billable, but still paid to the employee. If an employee has fifteen days or 120 hours of PTO in a year then they only have the potential of 2,089 hours or about 90 percent of their time actually available for direct billing (assuming no overtime). Further, if the employee charges time to non-billable things such as office meetings, professional development, etc., then the number of direct hours is further decreased by these indirect activities. If that amounted to around 100 hours for the year (two hours per week) then the 90 percent utilization rate in our example would decrease to around 89 percent. In general terms, that is considered a pretty good individual utilization rate.
Not all employees should be expected to have the same utilization rate since not all employees may have the same amount of paid time off. Further, some employees have greater responsibilities that aren’t billable associated with marketing, office administration, or management for example. Optimal utilization rates need to account for each employee’s necessary or expected non-billable time. Setting realistic utilization rates influences resource management since they help in forecasting true available time for projects and resource optimization.
Another way to look at utilization rate is for a group of employees, such as a project team or studio group. When using proper time tracking software, it’s possible to see not only who spent time on billable work and how much, but how much time within the group was allocated to non-billable, indirect time. Tracking the utilization rate of a group of employees this way is helpful in a variety of ways including the calculation of a billing rate to the client.
Utilization rates can also be looked at on the project level. When this KPI is used to look at every hour that is spent working on a project, it differentiates between those that were billable and those, which for whatever reason, were not justifiably billable. Ideally, close to 100 percent of the direct time is billable, but if the hours exceed the budgeted fee or if additional administrative time is needed, then those hours necessarily become indirect expenses. This illustrates the reason why this KPI is such an important metric since it measures the billing efficiency. Most architects appreciate the benefits of efficiency when it comes to building and construction. In the same way, managing a firm and projects that are likewise efficient should always be a goal.
It’s important to remember that the best way to monitor and respond to utilization rates is in real time which means time reporting must be efficient. Manual analyses waste time and delay understanding since they require gathering information from various sources and compiling it into a report. If this is the case, by the time the information is known, it’s generally too late to do anything about it. Computerized time sheets can overcome this.
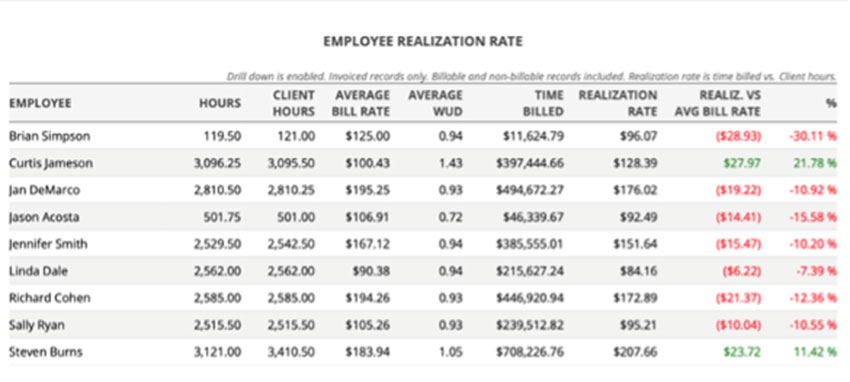
KPI #2 – REALIZATION
Just because an employee is highly utilized doesn’t necessarily mean that profitability is assured. To determine that, the KPI of actual dollar realization is needed. A Realization rate is calculable not as a percentage, like Utilization, but as currency. It’s the actual invoiced value of every hour that was worked by an employee on a project. In other words, it takes Utilization from a percentage and translates it into the value of an employee on an hourly basis.

Realization is the notion that revenue can only be recognized once the services have been delivered and earned. Learn more about the difference between utilization and realization rate.
Realization is important because on certain projects - or even on certain phases of certain projects - an employee may not be billing out fully for their hourly services. This might be because the project is part of a fixed fee arrangement based on the percentage of completion during the invoice period. In those situations, the hours worked don’t directly correlate into revenue based on hourly rates. In other cases, people are being utilized but the manager isn’t justified in billing for all the hours worked during that period for any variety of reasons. Good management software understands these types of situations and can still report out the revenue earned and adjust it on an hourly basis.
Understanding what causes Realization is critical to the health of a firm. It could be that a project is poorly managed, such as when a manager doesn’t give an employee sufficient information, but they proceed to do the work and then discover it needs to be redone. Alternatively, an employee may not be competent in the work being asked of them and it takes a lot longer to complete it. In this case the manager needs to write off some of those hours or if it is limited by a fixed fee, it gets written down by default.
All this feeds into fee negotiation at the outset of a project. A principal who negotiates a contract may not allocate enough fee to allow the team to properly execute the work. Conversely, the Realization rate could show up as very high because the principal may have negotiated fees for the projects that are more than sufficient to execute the work. Hence, this particular KPI is directly tied to negotiating skills at the outset as well as the effective management and competency of the project team.
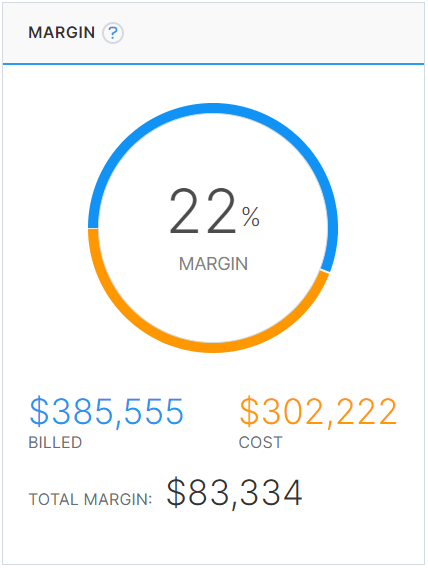
KPI #3 – PROFITABILITY
Most managers or principals are interested in this metric at the firm-wide level by looking at a Profit and Loss Statement. There, income received is compared against expenses incurred and the resulting difference is the profit, assuming it is positive number. If it’s a negative number, the firm is showing a loss (i.e., spending more money than it is bringing in).
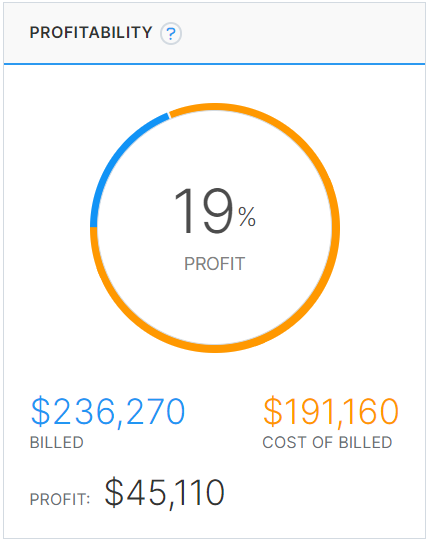
Profitability is how firms can determine whether a project was worth the investment of time and resources. It helps firms decide how to prioritize projects and learn from past mistakes.
The Profitability KPI applies directly to projects too, since a firm’s overall profit margin is dependent mostly on how profitable each project is. Software can generate reports to show the total value of invoices compared to the money spent through labor and expenses on a project to earn that income. Running regular reports on project profitability is helpful in identifying problems and prioritization of efforts. This KPI can be looked at down to the phase level as well, assuming the billing and time tracking are tied to specific project phases. This helps in understanding which phases of a firm’s projects are the most profitable and can lead to developing better contracts and fee proposals.
Monitoring project profitability alerts firm principals if it is below expectations and look for reasons causing that. This might include “scope creep” where the project work becomes more complex or requires more services than originally planned without a corresponding increase in fees. That might suggest that the fee proposal was insufficient or that the contract type wasn’t set up appropriately to allow for such additional work. It could also be due to low employee utilization which means project efficiency might be suffering.
Profitability can also be measured at the employee level if all employees accurately report their time allocation throughout the day. This reinforces the notion that time is the most fundamental piece of information that leads to a true understanding of a firm’s financial health. Reports can be run for any time period in this regard. Perhaps there is a need to see how each employee is faring over the past quarter or the current year to date. It can also be useful to compare prior periods to see if there is improvement in the direction of any employee’s profitability. Knowing what it costs to have an employee working at a firm compared to the revenue realized by that employee can play into the decision-making process for issuing individual bonuses where applicable.
KPI #4 – EARNED VALUE
To know where a project stands in terms of budget and schedule over time the KPI of Earned Value is particularly useful. The information that is used to generate this KPI comes from looking at all the time and expenses for the project plus all the invoices which represent the financial value. When projects are properly managed and have a basic budget and schedule, managers can get the information to compare past performance and forecast into the future. But the true benefit of Earned Value is to compare a project plan with its actual performance.
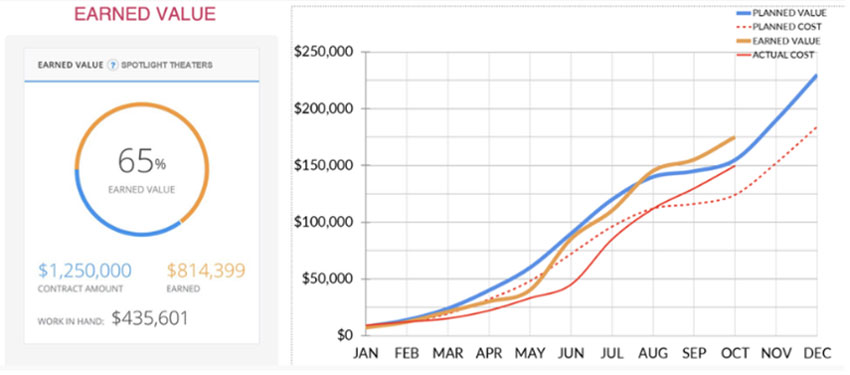
Earned value (EV) helps firms determine how a project is performing in terms of its budget and schedule. Earned value offers the best measure of progress as it measures the value of the work that has been completed at any point in time.
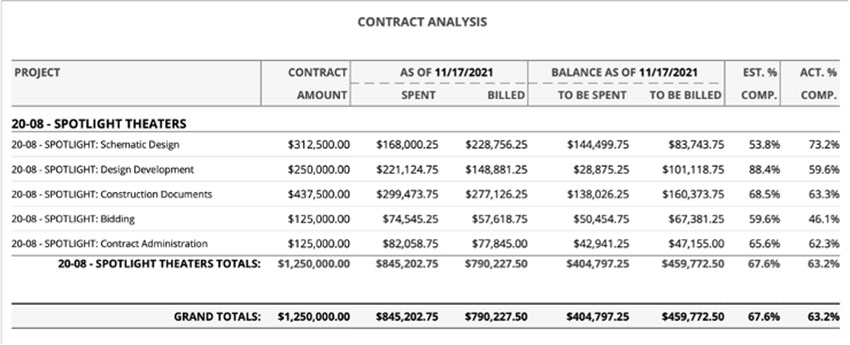
In this Estimated versus Actual Complete report, broken down by project phases, the contract amounts and the spent and billed amounts are shown. In this case, the client has been invoiced for 63.2% of the contract while earned value is at 67.6%, so billing is behind. Nonetheless, in the Schematic Design phase, the client was billed 73.2% of the scheduled fee but 53.8% of the effort was needed, indicating a profitable situation.
When represented on a graph, the planned, accumulated value of a project over time (i.e., monthly) can be plotted as it is expected to move through the various phases per the project schedule up to the full contract value. Some months may be expected to earn more value (i.e., billings) than others due to variations in the amount of work during or between project phases. Concurrently, the planned costs to the firm of producing that project can be plotted across the same time frame, presumably showing lower numbers for cost than for the billed value to realize some profit. With this as a stated backdrop, the actual costs and actual earned values can be added in as the project progresses.
Comparing the actual versus the planned numbers can be revealing to project managers and firm principals. If the Earned Value is less than the planned value, then that may indicate something is preventing the work from getting done as scheduled. That could be an internal overload of other project work that employees need to spend time on, or it could be an external factor such as a delay from the client or a contractor. Conversely, if the actual earned value is higher than the planned earned value, then that suggests things are moving faster than planned and fees are being earned ahead of schedule. At the same time, the costs can be compared. If the actual costs are more than planned or are approaching the earned value, then profitability is suffering. If they are tracking the planned costs or at least staying comfortably away from the earned value, then some profitability is being realized. That might mean some less costly employees are working on the project or that it is being managed efficiently to keep costs in check.
As the information is updated, it is also useful to see where the project stands at the most current point in time. Expressed as a percentage, it is good to know how much of the contract amount has been earned compared to the total amount of the contract. The remaining amount left to earn can be referred to as “work in hand” in the contract. This keeps managers informed as to the financial progress of a project so they can assess the resources they need to complete the project as planned.
KPI #5 – ESTIMATED VERSUS ACTUAL COMPLETE
In most firms, projects are broken into phases with corresponding percentages of the overall contract fee and cost allocated towards each phase. By keeping track of the actual amounts spent and billed in each phase, those numbers can be compared to the estimated (i.e., allocated) amounts. Comparing those numbers reveals which phases are showing greatest efficiency and profit compared to those that are exhibiting losses. For projects with a fixed fee contract, this KPI can reveal when there are big wins in profitability that can come about through efficient work and good project management. Of course, if clients are just being billed hourly, then the fixed profit margin that is built into an hourly rate should be all that is realized.
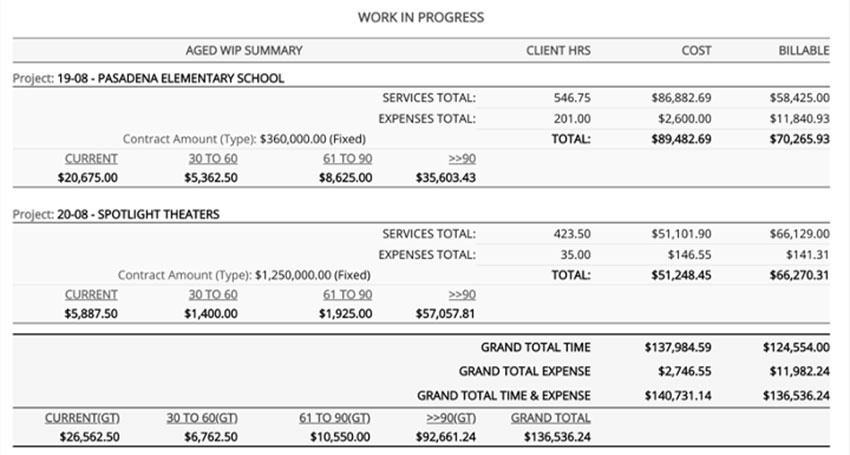
This report is looking at two projects which have a significant amount of WIP that is greater than 90 days. This is the kind of report that would have any firm stop in its tracks and figure out what has gone wrong here.
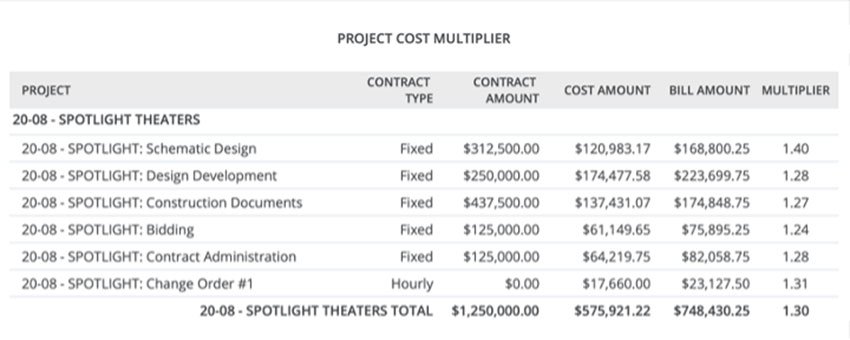
This report shows that this project has remained profitable through all of the different phases and, at the time it was run, was producing a Project Cost Multiplier of 1.3 or a 30 percent profit overall. Monitoring the project cost multiplier for the project and each individual phase provides insights into the profit margins garnered at various stages of the work.
Tracking and paying attention to the KPI of Estimated vs. Actual Complete is especially helpful since many firms find themselves overspending on the early design phases with the hope of making back that money during later phases such as construction documents. Instead of making this assumption, a firm should really look at the data to improve proposals and budgeting, so they better reflect reality. For example, it has been common for many firms to allocate 40 percent of their fees towards construction documents. However, with the advent of CAD and BIM technologies, firms are seeing that more value is being delivered earlier in the project. Therefore, they should reflect this in their fees. Following the health analogy, a firm is like a human body that needs to be fed properly through different physical activities, not starve it with the hope of a big meal at the end.
KPI #6 – WORK IN PROGRESS
Work in Progress (WIP) is the value of billable time and expenses that have not yet been billed on an invoice. It includes work that has been completed, or expenses incurred, but it is in the progress of being billed. WIP is recognized as an asset on the balance sheet and as (unbilled) revenue on the income statement.
This KPI metric provides managers with information to evaluate the progress of a project. To effectively manage a project’s budget, the manager must know what has been billed and what is available to bill. This gives the manager the power to proactively manage the budget, guide billing and identify any potential overruns.
Some of the most profitable firms track the aging of their WIP. That means the amount of time that it requires to invoice for the WIP. If it is over 90 days, for example, that indicates that employees are being paid, but they bring no billable benefit for three months. It can also be a red flag that the project isn’t progressing as planned or there may be an error in billing.
KPI #7 – PROJECT COST MULTIPLIER
This next KPI focuses in on the actual performance of a project. We are calling it the Project Cost Multiplier, but it is also sometimes referred to as a Net Multiplier. Either way, this is a measure of actual performance - how much money is actually being earned for every dollar spent on direct labor. As such, it’s a measure of results and is a gauge of the financial well-being of a project and, ultimately, the firm.
There are two things that directly affect how the Project Cost Multiplier is calculated. The first is the actual employment costs which is specific to each employee, represented by the unit of 1.0. The second is the overhead rate which is the cost of non-project related expenditures (indirect expenses, including indirect labor), expressed as a percentage of total direct labor. The lower a firm’s overhead rate, the higher the profit margin - a target of 150-175 percent (or 1.5 to 1.75 x total direct labor), is generally acceptable.
Combining the direct employment cost with the overhead rate yields the actual cost of doing business. Billing at that level means the firm would just be meeting expenses so it is referred to as the “break-even” rate. If, for example, a firm has a 1.5 overhead rate, that would be added to the 1.0 employment cost resulting in a break-even rate of 2.5. More specifically, an employee with a $100,000/year salary would have a break-even rate of $120 per hour. ($100,000 divided by 2,080 hours = $48/hour times 2.5 = $120/hour). In order to obtain a 20 percent profit, then the billing rate would need to be $150 per hour.
The Project Cost Multiplier takes all of the above into account by comparing it to the break-even rate. If the Project Cost Multiplier is 1.0, it is the same as the break-even rate meaning there is zero profit. If it is greater than the break-even rate (i.e., 1.01 or more), then the firm is earning a profit, if it is less, (0.99 or less) it is losing money. Like many KPIs, the Project Cost Multiplier can vary from phase to phase. Much of this differential has to do with the costs of the employees doing the work as it relates to the billable value of their time. Hence, having the information available so it can be analyzed not only on the project and phase level but even at the activity level, helps firms learn which project types, phases, individuals, and services provide the greatest profit margin.
KPI #8 – AGED ACCOUNTS RECEIVABLE
The final four KPIs that we are covering are generally considered to be firm level metrics. However, it’s always important to consider everything within the firm at the project level since the projects are the source of the information that is being fed into the firmwide information. If something doesn’t look right or is troubling, it can usually be traced to a particular project or client where it can be properly addressed and managed.
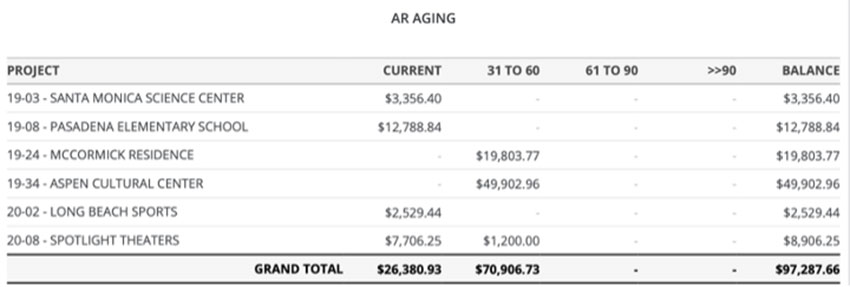
Aged Accounts Receivable shows where payments stand in relation to the due date of the invoice. When receivables age greater than 60 days, the likelihood of collections decreases.
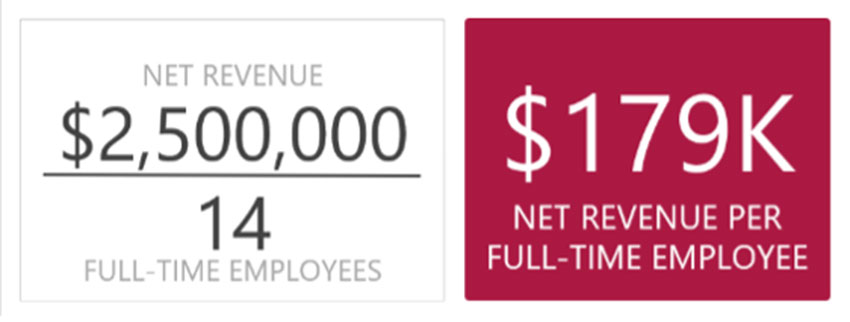
Understanding what a firm’s net revenue per full-time employee is provides information to plan annual budgets both for expenses as well as for revenue. Prevent your firm from losing revenue.
All firms track their Accounts Receivable (i.e., invoices sent out that haven’t been paid yet) but might do it in different ways. Some firms like to calculate their average Accounts Receivable (AR) and use that as a benchmark each month of the amount of business they are doing. The annual average accounts receivable can be determined by adding up the value of accounts receivable at the end of each of the past 12 months and dividing by 12. Of course, if a firm is growing, it is perfectly reasonable to see AR grow as well. So, just looking at average AR values going up isn’t the best indicator. It must be considered in context–is the firm actually growing or is it taking longer to get paid?
The time between the date of the invoice being issued and actually receiving payment is referred to as the aging of the Accounts Receivable. Usually, invoices are considered current if they are paid within 30 days although some clients require up to 60 days to pay. Someone at the firm should be paying close attention to any aging AR. That’s because, in general terms, it’s usually very difficult to collect on invoices that are greater than 60 days old. It is a significant concern for any aged AR that are greater than 90 days since the common experience is that they become almost impossible to collect and may have to be written off. That can immediately change all the profitability and firm health numbers we have seen thus far.
KPI #9 – NET REVENUE PER EMPLOYEE
One way to benchmark a firm as compared to other firms is to look at the net revenue being generated per full-time employee. For example, in the United States, the average architectural firm yields about $151,000 per full time employee per year. So, a 10-person firm with $1.5 million in annual net revenue would indicate they are pretty much average under this KPI. Firms that are averaging closer to $200,000 in revenue per employee are likely very profitable.
Net revenue is a measure of past performance over a year─how much money did the firm bring in for itself (i.e., not counting consultants, etc.). The net revenue per employee is calculated by dividing the annual net operating revenue by the total number of full-time employees. This metric becomes useful for planning and forecasting a realistic range for future annual net operating revenue.
KPI #10 – RUNWAY OR BACKLOG
This KPI is focused on how much work is remaining in existing contracts but has not yet been completed or billed yet. Some people will simply call this “backlog,” or it may be called the “runway” because you don’t want to get to the end of your runway. By taking some data from the Work in Progress KPI and related data, it is possible to see how much contract work is remaining. Dividing that by the total monthly cost to keep the firm running indicates how long before the firm is out of work, and out of money. As a strategic measure, it is often best to subtract out the portions of the Construction Administration fees that will be earned beyond the next 12 months since that timing may not be predictable.
Determining the backlog/runway is often critical in terms of planning for future months or years of the firm operating. For example, if the analysis shows more than a year of reliable contracted work with project time schedules to match, then it is likely that the firm will be busy and potentially on good financial ground. On the other hand, if it shows only six months or less of runway, then there are really only two basic choices - either bring in new work or plan on lay-offs. Of course, some firms might take the approach that they are anticipating new work and don’t want to lose good employees until that work comes through. In that case, they might have some cash reserves to dip into and use that to extend their runway, but this carries some obvious risk. It is always good practice to maintain at least three months or more of operating reserves to carry the firm through other unexpected financial issues. So, any dipping into reserves should keep that minimum balance intact.
KPI #11 – PROPOSALS PENDING
One final KPI to think about is the value of any proposals for new work that are pending. Seeing both the various stages of the proposal process and the probability of success allows managers to determine both short-term and long-term impacts. Is there the possibility that more staff will need to be hired if a lot of the work comes through? Or is there just enough to keep the current size of the firm going. Worse, though, is there too much competition or uncertainty about enough of them that something else needs to be planned?
It is often tempting to consider potential projects in the backlog/runway analysis and some managers will do so if a pending proposal shows a 50 percent or greater chance of becoming a contract. However, a more conservative financial approach recognizes that plenty of things fall through, often due to no fault of the firm. The economy can change, a client may not really have everything in place to proceed, or a new decision-making Board may vote to break with tradition and hire a new firm. Hence, it is often best not to consider the proposals pending in the runway numbers, even if they have a 99 percent probability. Running the business finances conservatively in this regard allows firms to afford taking the type of risks they would prefer when it comes to performing the services.
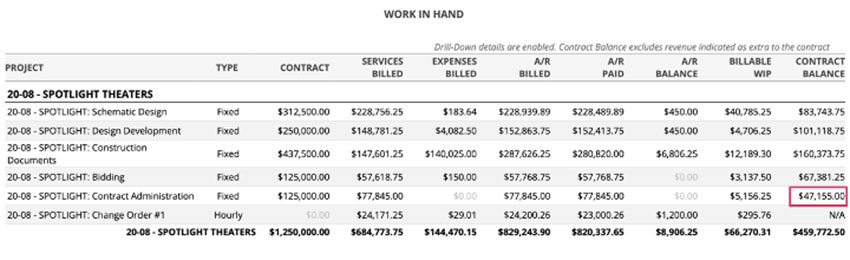
A Work in Hand Report allows managers to look at all active projects, see the contract values, and show the remaining value. After deducting Construction Administration services that are more than 12 months out, the backlog or runway can be determined. In this case, expected revenues total $1,759,000 over the next 12 months. If monthly expenses are $135,000, then there is a 13-month runway. If expenses are $155,000, there are only 11 months of runway.
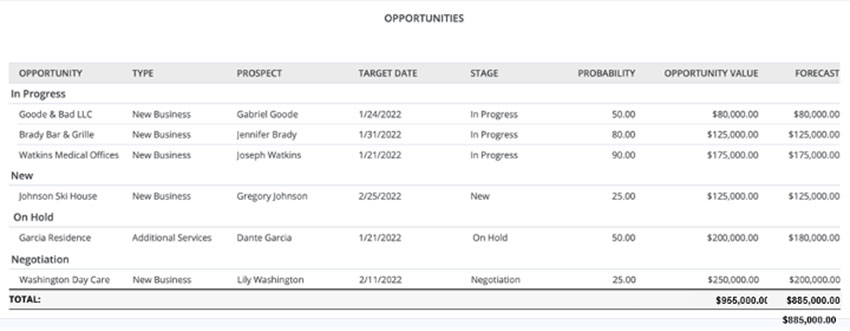
A proposals pending report can provide a snapshot of future potential work but should not be relied on for projecting backlog or runway.
SELECTING COMPUTER SOFTWARE TO TRACK KPIS AND FIRM HEALTH
Based on all of the foregoing, it is clear that there are some fundamental and useful points of information that, when provided in real-time, allows project managers, firm principals, and other employees to assess the financial health of a firm. It also allows them to react, plan, and respond to current and future needs. It should also be clear that the best way to track and receive the needed information is using computer software that is specific to design firms. While there are several such programs available, selecting computer software for managing projects and firms should be based on meeting a variety of needs, which can include the following:
Integrated Functions Firms can improve efficiency and accuracy with an all-in-one platform that combines front office functions (project management, Client Relationship Management) with back-office processes (time and expense tracking, invoicing, electronic payments, accounting, and HR). This allows managers and principals to understand the full financial implications of project decisions with integrated project accounting and project management tools.
Streamlined Input Process The software should allow all employees to save hours every week with streamlined, automated processes, including time/expense tracking and invoicing. It should accurately account for every billable hour and expense with time tracking and automated expense capture/mapping to projects and invoices. Less manual input means teams can focus more on project delivery.
Real-time Reporting Software should provide real-time views into profitability at the levels of the firm, the client, project, phase, and employee. Instantly seeing a firm's health and project performance with easy-to-read dashboards is a plus. Real-time visibility into project performance at each phase helps prevent cost overruns, poor team performance, and missed deadlines. It also ensures everyone stays in the loop with flexible, automated, sharable reporting.
Project Management Support Managers should be readily able to confidently manage phased projects and invoicing based on percent-complete values. The software should also easily separate basic services from additional services on a single invoice. At the same time, it should help prevent overworked or underutilized staff by monitoring utilization rates in real-time. All of this allows project managers to focus on true profit and loss issues.
Mobility Many firms require the ability to manage from anywhere. This can be achieved with the full functionality of a mobile app.
In the end, it is up to the firm’s principals to decide on which software to use and how to implement it, but it is certainly beneficial to keep all the project managers and other employees in mind. They are the ones who will need to embrace it and use it as much as the principals.
Conclusion
Responsibilities for practice management are varied and significant, so finding tools that illuminate Key Performance Indicators of the financial health of the firm are often welcome. Principals and Project Managers should think carefully about which KPIs are most important to the firm and set up a process for getting that information quickly and efficiently. While it is true that you can’t manage what you can’t measure, it is also true that if there are areas you don’t intend to manage, then don’t waste time measuring them. Rather, use the tools available to create the most appropriate and useful system to track the financial health of projects, employees, and the firm overall.
Peter J. Arsenault, FAIA, NCARB, LEED AP is a nationally known architect and a prolific author advancing positive acoustical experiences through better building design. www.pjaarch.com, www.linkedin.com/in/pjaarch
Resources
How to improve your utilization rate.
Learn more about the difference between utilization and realization rate.
How to improve project profitability.
Learn more about what earned value can teach you about the clients you work with.
Learn more about how to analyze your firm’s contract, budget and billability reports..
Get tips on how to create a strong Work in Progress report here.
Learn 6 tips to improve receivables and get paid faster.
Prevent your firm from losing revenue. Download the ebook, “Your Office is Leaking Money: How to Identify Losses and Plug the Holes".
Learn how to build a better proposal on this webinar.