All images courtesy of IAPMO
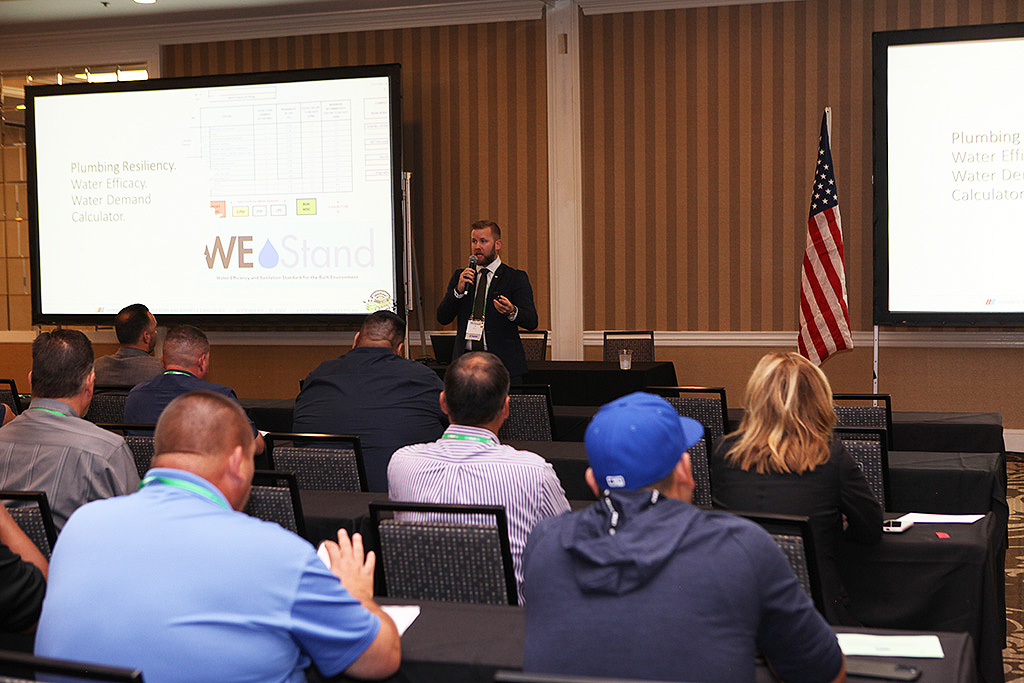
Christoph Lohr, Vice President of Technical Services and Research at IAPMO and a nationally recognized plumbing engineer and water systems advocate, is a frequent presenter on the benefits of using the IAPMO Water Demand Calculator® instead of the outdated Hunters Curve.
This article equips plumbing engineers and system designers with the knowledge to apply right-sizing strategies for residential plumbing systems based on modern water use data. Participants will explore how traditional pipe-sizing methods, specifically the Hunter’s Curve, often result in oversized systems that increase costs, waste water, and contribute to water quality issues. The article introduces design methodologies that align with current fixture efficiency standards and water usage patterns, with a focus on multi-family systems. Emphasis will be placed on how right-sizing using the IAPMO Water Demand Calculator® supports housing affordability, accelerates hot water delivery, and helps mitigate waterborne health risks, while contributing to sustainability goals in the face of urbanization and climate change.
Moving Beyond Hunter’s Curve
For nearly a century, Hunter’s Curve has served as the foundation for estimating water demand in residential, commercial, and institutional buildings. Developed in the 1940s by Roy B. Hunter, a physicist employed with the U.S. National Bureau of Standards (now the National Institute of Standards and Technology), the curve was part of a broader effort to create standardized methods for sizing plumbing systems in buildings of various occupancies. At the time, the plumbing industry lacked a coherent, data-driven approach to predict peak water demand. Most sizing methods were based on either empirical rules-of-thumb or significantly conservative estimates, often resulting in inconsistent and sometimes inadequate water distribution infrastructure.
Thanks to mass manufacturing of plumbing parts and the standardization of residential and commercial building types, plumbing fixtures such as toilets, faucets, and bathtubs became more uniform in design and water use. Hunter’s objective was to develop a rational method for translating the number and type of plumbing fixtures in a building into a reliable estimate of peak water demand, accounting for the improbability that all fixtures would be used simultaneously. The goal for Hunter was to find a standardized and simple way to calculate water demand for buildings that would accommodate all needs by all users, all the time. The concern was not water conservation, but effective and uninterrupted distribution. To accomplish this, Hunter introduced the concept of “fixture units,” which allowed designers to categorize fixtures by their relative load on the water supply system. Each type of fixture was assigned a specific number of fixture units based on its average flow rate and usage characteristics.
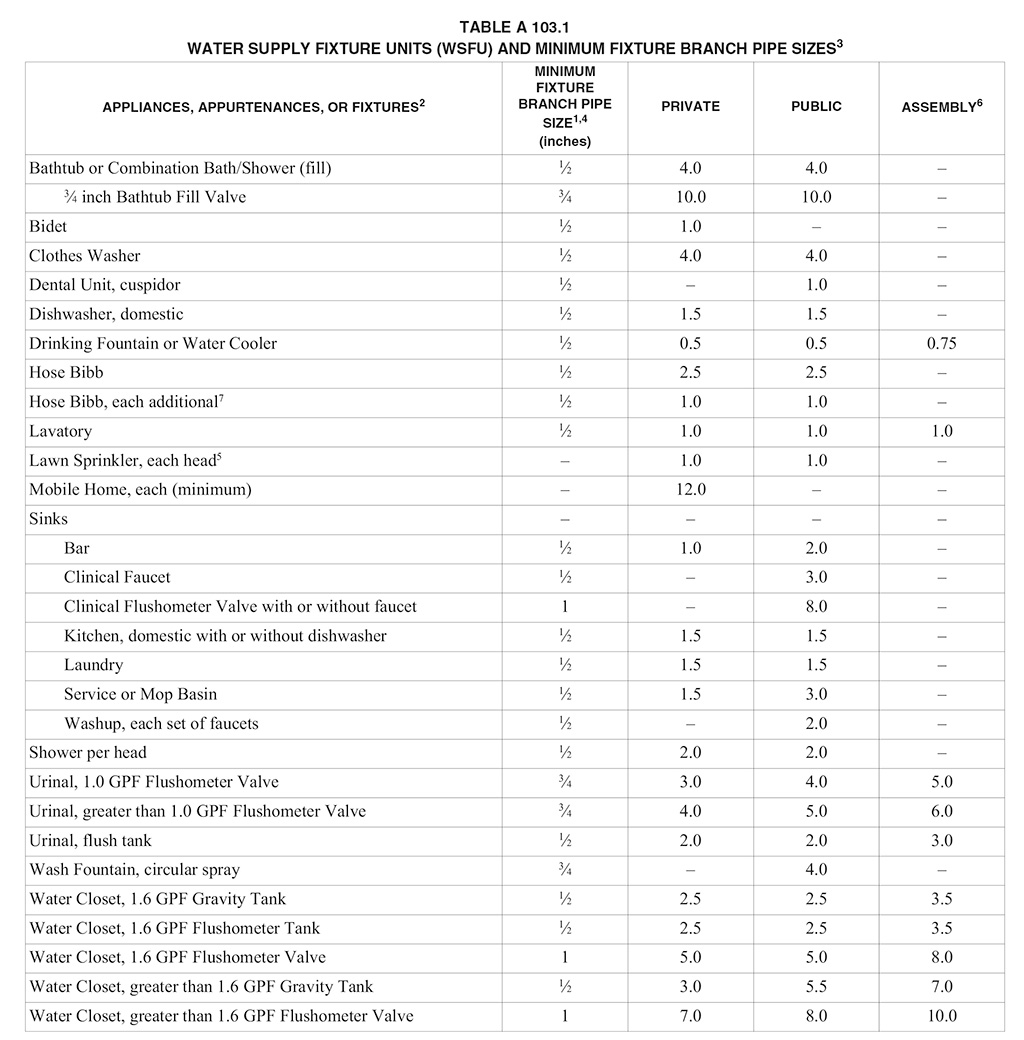
Hunter introduced the concept of “fixture units,” which allowed designers to categorize fixtures by their relative load on the water supply system. Each type of fixture was assigned a specific number of fixture units based on its average flow rate and usage characteristics.
Hunter applied probabilistic modeling to determine the likelihood of concurrent fixture use within a building. The resulting model, now known as Hunter’s Curve, plotted the total number of fixture units on the horizontal axis and the predicted peak water demand on the vertical axis. This curve allowed engineers and designers to size supply piping and equipment based on the 99th percentile of a binomial distribution of a given number of different kinds of plumbing fixtures. In effect, Hunter’s Curve introduced a discrete probabilistic method to prevent under-sizing while avoiding the extreme costs and inefficiencies of over-designing the plumbing system.
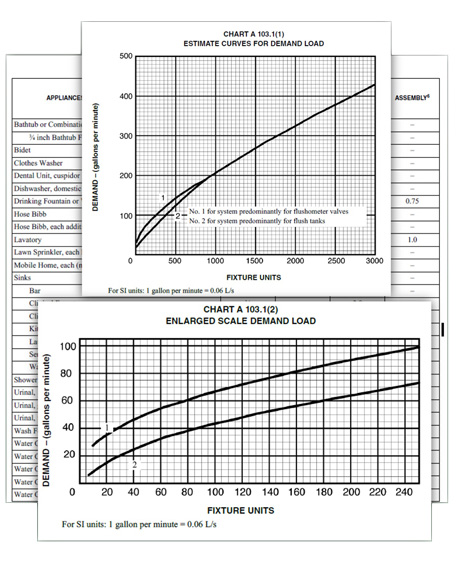
The Original Hunter’s Curve plotted the total number of fixture units on the horizontal axis and the predicted peak water demand on the vertical axis. This curve allowed engineers and designers to size supply piping and equipment without assuming maximum simultaneous use.
The Hunter’s Curve and its associated fixture unit method were adopted into plumbing codes and handbooks throughout the mid-20th century and remain in use today in various forms. The Uniform Plumbing Code (UPC®) and the International Plumbing Code (IPC) both base their sizing methodologies on these principles, even though they have since made minor adjustments to reflect evolving fixture efficiencies and building uses.
As awareness has increased that different buildings have different usage patterns and plumbing fixtures have become increasingly efficient due to codes and standards such as the Energy Policy Act of 1992 and WaterSense® labeling, the underlying assumptions behind Hunter’s Curve have become less valid. Flow rates for fixtures such as toilets and faucets have dropped significantly, often by more than 50% since Hunter’s time. Moreover, modern society has buildings with distributed occupancy patterns, irregular schedules, and usage profiles influenced by automation and behavior changes. For example, high-efficiency sensor-activated faucets, low-flow toilets, and smart metering all contribute to a water demand landscape fundamentally different from what Hunter observed in the 1940s.
In principle, a plumbing water distribution network should be tailored to the specific occupancy patterns, fixture types, and usage profiles of the building it serves. This is particularly true for multi-family buildings, where the diversity of use can already introduce variability. Oversized systems result in multiple inefficiencies. First, excessive pipe diameters lead to increased material costs, which are passed on through higher construction budgets. Second, oversized systems often experience low velocity flows, especially at off-peak times. This contributes to stagnation in the distribution system, raising concerns related to water age, microbial growth, and water quality. In healthcare settings and large commercial buildings, where waterborne pathogens such as Legionella can be a concern, the mismatch between system size and actual flow can create unintended public health risks.
The development of Hunter’s Curve was groundbreaking and represents a landmark in plumbing engineering history. However, research and the development of new calculation technology have moved past the need for a mid-20th-century statistical model. Proper sizing of water systems involves more than just code compliance. It demands an understanding of actual fixture flow rates, building usage schedules, and the hydraulic behavior of water distribution networks. As fixture efficiencies improve and occupancy patterns become more dynamic, historical sizing methods that favor generous safety margins increasingly lead to inefficiency. The goal of modern plumbing design should be to align system capacity with demand in a way that maximizes performance without introducing waste—whether of water, energy, or capital resources.,
The IAPMO Water Demand Calculator—A New Standard for Residential Sizing
Recognizing the need for a more accurate, reliable, and consistent tool for predicting water demand and usage, the plumbing industry responded by first creating an extensive field study in 2009 and then developing a sophisticated yet easy-to-use tool.
Introduced in 2017 by IAPMO, the Water Demand Calculator tool was developed in response to a growing body of evidence that traditional water demand estimates were no longer accurate or appropriate for modern buildings with water-conserving “efficient” fixtures. The IAPMO Water Demand Calculator represents a significant advancement in plumbing system design, offering a scientifically grounded alternative to methods and assumptions based on Hunter’s Curve.
The development of the calculator was driven by a multidisciplinary team of engineers and statisticians. Their goal was to create a tool that would be accurate, accessible, and acceptable for inclusion in plumbing codes. At the heart of the IAPMO Water Demand Calculator is a modern statistical model based on extensive field data and probabilistic analysis. Unlike Hunter’s Curve, which relies on fixture unit counts and assumptions about simultaneous usage, the IAPMO Water Demand Calculator uses empirical data gathered from real-world water usage in contemporary single-family dwellings. This includes data on fixture flow rates, frequency of use, duration of use, and occupancy patterns—factors that have evolved significantly over the past several decades due to changes in regulations, technology, and lifestyle.
Real-World Research
What distinguishes the IAPMO Water Demand Calculator from previous projected water use methods is the inclusion of real-world observed data. In 2013, IAPMO, the American Society of Plumbing Engineers (ASPE), and the Water Quality Research Foundation (WQRF) jointly funded a research project using data provided by Aquacraft Inc. to update Hunter’s Curve for estimating water supply for residential applications using water-efficient fixtures. A special task force led by Dan Cole (IAPMO) and comprised of members from ASPE and the University of Cincinnati was formed to revise the methodology for properly estimating water supply demands in response to the increased use of water-conserving plumbing fixtures, fixture fittings, and appliances, and the subsequent decreased demand for water in commercial buildings and residences. The charge of the task group was to develop a statistically based probability model that would predict the peak water demand for single and multi-family dwellings having water-conserving plumbing fixtures.
The first step in the process of developing a more accurate way to calculate water demand started with a broad and extensive research and statistical data-gathering venture. The research resulted in a published document in 2017 called the Peak Water Demand Study: Executive Summary.4 The Peak Water Demand Full Study was released in 2025.5
Over 1,000 single-family households were used as the basis of the study. Using portable data loggers connected to each home’s main water supply line, the research team captured real-time water flow data every 10 seconds. Each recorded instance of water usage or “event” included information on flow rate, duration, and total volume. By aggregating this data, the researchers were able to build a detailed database of when and how often plumbing fixtures were used.
To understand specific water demand and usage, six unique fixtures groups were identified as common to most of the 1,000 participating homes. For each fixture, both events (single-time demand calls) as well as overall volume were recorded and considered.
Faucets had the highest percentage of water use events at about 75%, with a 21% volume of water consumed. In contrast, showers and clothes washers recorded less than 3% each of water use events but accounted for about 24% each of the volume of water consumed. Toilets had the highest volume of water consumed at a fixture, while dishwashers had the lowest number of events and volume of water consumed. Although the number of water-use events shows a wide variation in the frequency of fixture use, the duration and flow volume are consistent with typical residential fixture characteristics.
In total, the study recorded about 863,000 water use events, excluding leaks. From this dataset, the team calculated the relative frequency of fixture use as a proportion of total system demand. These usage patterns, the number of fixtures and appliances, along with their respective flow rates, were fed into statistical algorithms to calculate peak demand.
Although the national database had water use records for only single-family homes, the statistical information was found to be valid and applicable for multi-family dwellings, as well. Because it can be assumed that each unit in a multifamily building operates independently of the other units, water use data from multiple randomly selected single-family households were assembled and assumed to be units in a building to mimic water use in a multifamily building.
One of the major flaws in the older Hunter’s Curve methodology was the unrealistic assumption that a building’s water system should be sized to supply fixtures under congested use, i.e., a line of people waiting to use the fixture. The field data clearly disproved this notion. Instead, the study identified the “peak hour” of demand—the single hour with the highest volume of water use—and assessed the probability that each fixture was active during this period.
Armed with actual statistical and observable results, IAPMO embarked on updating Hunter’s Curve and establishing a new computational model based on field data. The result was the IAPMO Water Demand Calculator tool.
One of the key technical innovations of the IAPMO Water Demand Calculator is its dynamic treatment of fixture characteristics. Unlike Hunter’s Curve, which assigns a fixed fixture unit value regardless of fixture type or efficiency, the calculator distinguishes between flow rates and probabilities of use for each fixture. For example, a high-efficiency showerhead and a traditional tub faucet are modeled differently, reflecting their divergent flow profiles and usage frequencies. These refinements allow the IAPMO Water Demand Calculator to respond to code-mandated changes in fixture specifications, such as the 1.28 gallons per flush requirement for toilets or the 1.5 gallons per minute limit for bathroom faucets under EPA WaterSense Specifications.
In addition, the calculator accounts for the diversity of demand within multifamily housing by accounting for each individual fixture in each dwelling unit and then aggregating their demand probabilistically. This approach avoids the overestimation common in aggregate fixture unit counts. This is especially important in large buildings where traditional sizing methods lead to increasingly oversized systems. In contrast, the IAPMO Water Demand Calculator’s probabilistic framework reflects the fact that not all residents use water fixtures simultaneously or at full flow rates, even during peak periods.
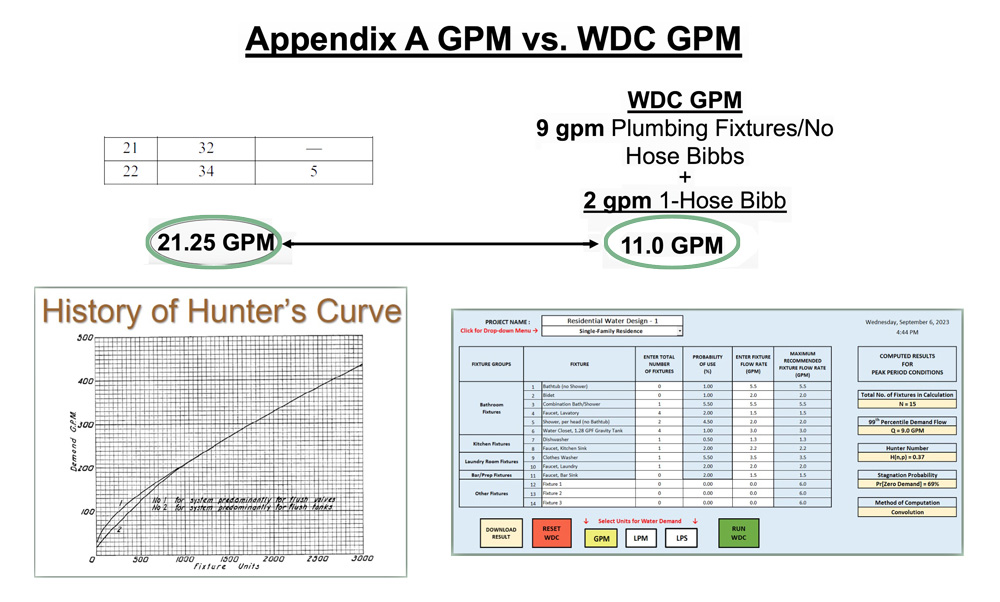
A comparison between GPM expectations using the Hunter’s Curve versus the updated estimations using the IAPMO Water Demand Calculator. Given the above criteria, the Hunter’s Curve estimated a supply capacity of 21.25 GPM versus 11.0 GPM with the IAPMO Water Demand Calculator.
How It Works
“The data showed us that replacing Hunter’s Curve with another curve was not feasible as different building sizes required different fixture probability values and methods,” said Toju Omaghomi, original designer of the IAPMO Water Demand Calculator and now Industry Research Manager at IAPMO.
While technically an engineer could calculate the potential water usage of a project, accurately gathering and applying these values for a full building model would quickly become a cumbersome task. With this in mind, the IAPMO Water Demand Calculator was designed specifically to be a user-friendly, downloadable Excel tool that uses built-in macros to automate the selection and application of the appropriate calculation method.
By entering basic fixture and building data, users can generate peak indoor water demand estimates without needing to manually run statistical models or choose between competing calculation paths. For system engineers, there is a wide range of variables that can be input into the IAPMO Water Demand Calculator to better determine the appropriate and right-sized plumbing system. For instance, a user can input the project name, type of building, fixture count, and fixture flow rates.
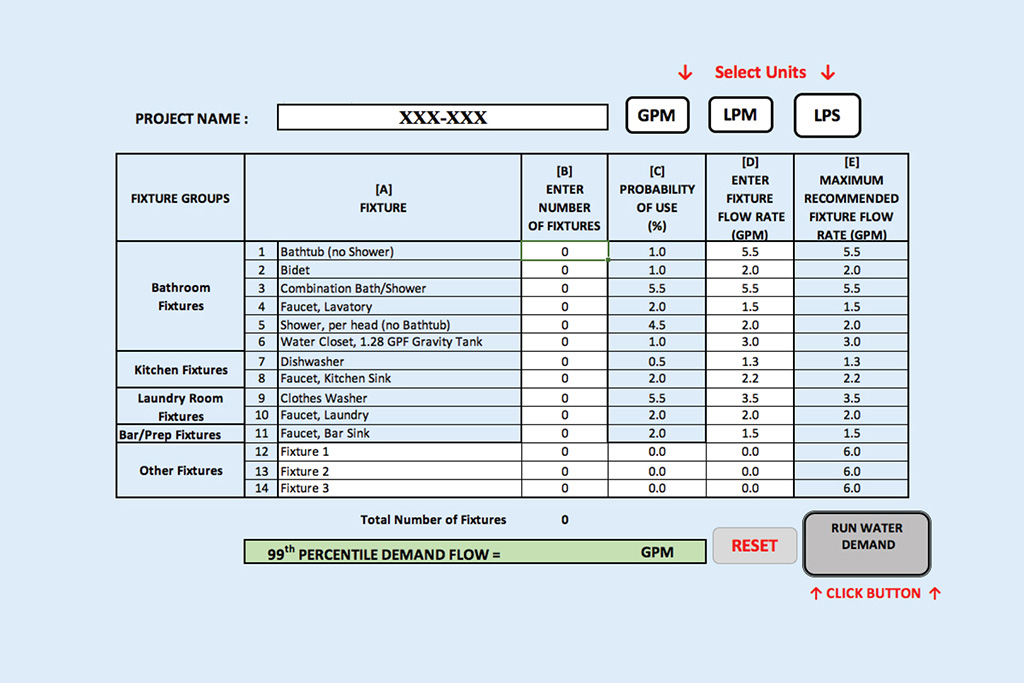
This screenshot of the IAPMO Water Demand Calculator shows the variables that engineers can enter into the tool to determine the most appropriate and properly sized plumbing design for the project.
With a simple “Run WDC” command, the tool will provide computed results for peak period conditions. To find the estimated demand for each pipe segment of a water distribution system, the pipe size can be found by consulting your plumbing code. In most cases, the updated calculations will allow for smaller pipe sizes as the actual demand (compared to Hunter’s Curve) will be significantly less.
Moving to a New Calculation Method
Christoph Lohr, Vice President of Technical Services and Research at IAPMO and a nationally recognized plumbing engineer and water systems advocate, has found that convincing engineers to upgrade from antiquated systems to the IAPMO Water Demand Calculator isn’t a hard sell. “When I describe the advantage of the IAPMO Water Demand Calculator in summary, I explain how with the old method, you had to count up the total number of fixtures and convert that to a fixture unit and then translate that into a gallon-per-minute figure to size your pipe,” Lohr explains. “With the IAPMO Water Demand Calculator, you eliminate that middle step. You just count your fixtures, enter it into the Excel document, and then estimate the GPM. You cut out the whole fixture unit methodology.”
After the IAPMO Water Demand Calculator was published in the 2017 Water Efficiency and Sanitation Standard (WE•Stand), it was formally introduced in the 2018 Uniform Plumbing Code (UPC) as Appendix M and has since been adopted by multiple jurisdictions as an optional or approved method for sizing cold and hot water supply systems in residential applications.
To quantify the impact the IAPMO Water Demand Calculator can have on plumbing distribution systems, it is important to reference previous water use estimations projected using Hunter’s Curve.
This chart represents hot water supply data collected during the period of 2019 to 2022 by the Association for Energy Affordability, 2050 Partners, and Gary Klein Associates, and other industry-affiliated research organizations. Monitoring of the hot water usage ranged from nine days to more than two weeks, and logging intervals ranged from 1 to 60 seconds. What the data illustrates is that, based on traditional Hunter’s Curve methodology of predicting peak flow rates (noted in red), actual usage observed in the field was significantly less. For instance, the 24 multifamily units in Rotterdam, N.Y., were projected to require over 70 gallons of hot water per minute to meet demand expectations. However, actual usage showed that average use was roughly around 5 gallons per minute of hot water.6
The blue data points in the chart represent the expected hot water use as projected by the IAPMO Water Demand Calculator. In the example of Rotterdam, the IAPMO Water Demand Calculator estimated a peak demand of around 20 gallons per minute of hot water. This projection, while still more than robust enough to supply ample water continually to the occupants, has exponential implications for engineers when considering plumbing sizing, material and construction cost, and system design.
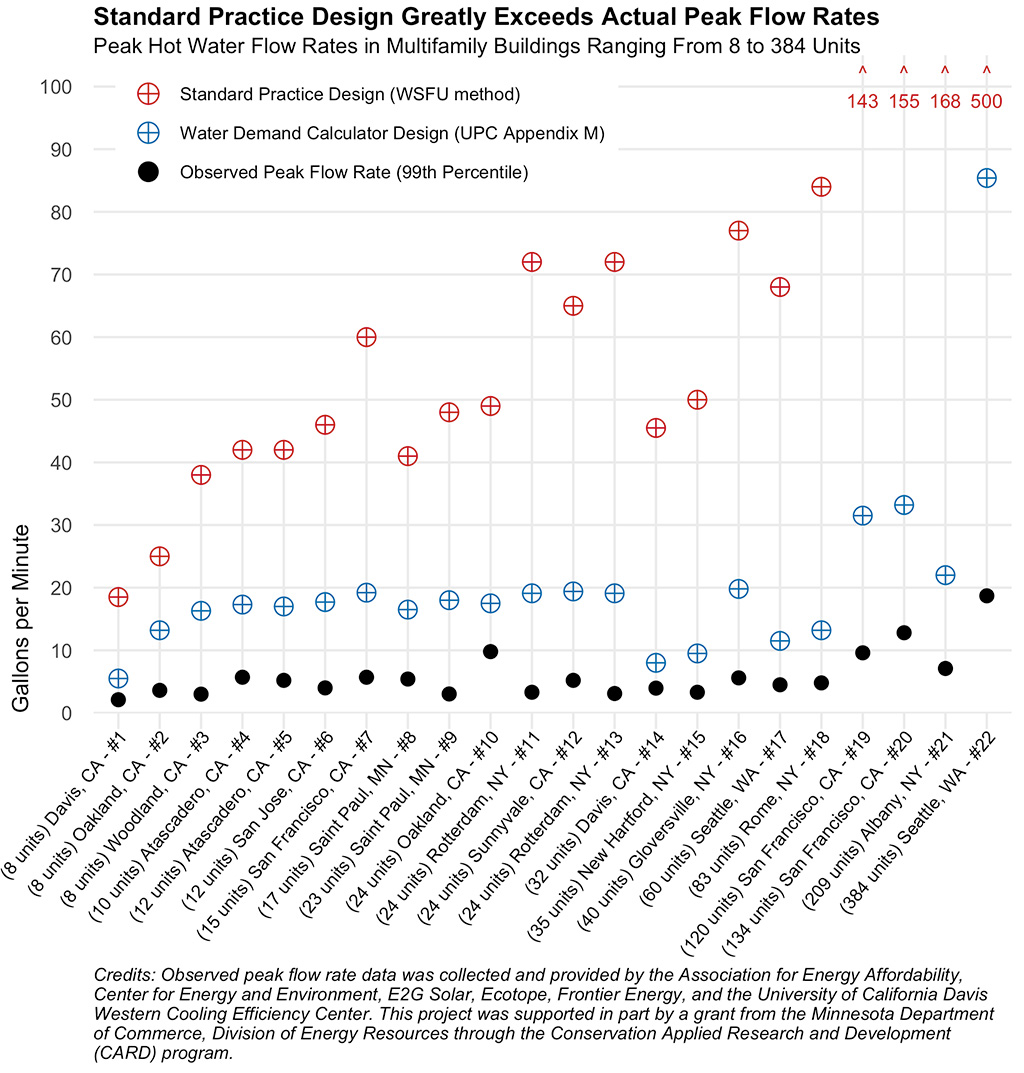
Based on the analyzed actual hot flow rates from 20 multifamily buildings, standard practice water calculation methods using Hunter’s Curve (red) result in design values 5 to 27 times larger than observed (blue). Actual observed usage (black) shows the comfortable margin of employing the IAPMO Water Demand Calculator to ensure ample flow even during peak use hours.
Though observable data showed that actual peak water usage was a mere fraction of Hunter’s Curve expectations, IAPMO built the tool to ensure accurate and reliable water distribution.
“When developing the IAPMO Water Demand Calculator, it was important to ensure that the tool never underestimated potential water use. That would be bad, so the results that the tool delivers generally range from 2 to 6 times the peak water demand,” Lohr says. “You don’t want to end up with a lack of pressure, or even potentially backflow.”
The Sustainable and Economic Benefits of Right-Sizing Plumbing
The economic impacts of oversizing plumbing systems are often underestimated during design. Larger pipes and fittings increase material and labor costs while also requiring more substantial insulation and support infrastructure. These costs are locked into the building from the outset and cannot easily be recovered.
For building owners and occupants concerned with water conservation (from both an economic and environmental standpoint), right-sized plumbing systems can reduce both material costs and resources during construction, as well as offer conditions for efficient water use. The inclusion of sustainable design in modern construction is often a measurable way to evaluate potential cost savings from reduced energy over the life of the building. However, there remains reluctance in the engineering community to fully embrace sustainability when it comes to plumbing design.
“Sustainability initiatives have a tendency—or have a reputation—that they increase the initial cost and save you down the road,” Lohr explains. Lohr sees that this perspective often results in sustainable building plans stalling when it comes to plumbing design. While the plans may call for low-flow fixtures and high-performance appliances, engineers are reluctant to consider resizing water distribution for fear of poor performance. “Even in California, where the Energy Commission requires a benefit-cost analysis—usually, they want to see a payback within two to five years,” he says.
The California Energy Commission requires a benefit-cost analysis as part of the process for adopting new building standards. This analysis helps determine whether a proposed change, such as a new efficiency measure, provides more value over time than it costs to implement. It looks at both the upfront expense and the long-term benefits, such as savings on water or energy bills, and is used to decide if a new requirement is cost-effective for homeowners and builders. The goal is to make sure that any new regulation delivers a reasonable return on investment and doesn’t create unnecessary financial burden.
Lohr explains that when comparing plumbing system costs designed using conventional methods like Hunter’s Curve to those sized with the IAPMO Water Demand Calculator, the results were unexpectedly dramatic. Because the calculator is based on actual usage patterns and statistical modeling, it produces designs that are often more efficient and less costly from the outset.
“It’s funny,” Lohr remarks. “When the initial cost is lower—it’s not an additional cost, it’s less than the original cost.” This shift in baseline costs led to an unusual finding when the numbers were run. “All of their analyses with the IAPMO Water Demand Calculator—the benefit-cost analysis came back as infinite, because you start off from a lower point already.” Rather than requiring years to recoup an investment, the benefits begin immediately—challenging the very structure of conventional economic evaluation models.
In practical terms, Lohr has witnessed firsthand the impact that right-sizing plumbing design can have both on the project and also the engineers designing the system. “For some of these very large multifamily projects where you have 150 or even 200 units, right-sizing the pipe coming in can make a huge difference,” Lohr says. “I’ve worked with engineers who have done a lot of these projects and estimated the old school way. When they see that in some cases their four-inch pipe can be downsized to an inch and a half, they have a hard time believing it, but the data is there.”
In 2021, IAPMO released findings from the architectural firm Stantec that calculated the material and labor cost savings potential of applying the IAPMO Water Demand Calculator as compared to the sizing methods contained in baseline plumbing codes, including IAPMO’s Uniform Plumbing Code (UPC®) and the International Code Council’s International Plumbing Code (IPC), and International Residential Code (IRC). The study included nine projects in three cities: New York City, Pittsburgh, and Oklahoma City.
What the data showed (see image) was that savings ranged from 2-16% depending on the size of the project, material costs, and calculation method. For a 45-unit multi-family project in New York City, utilizing the IAPMO Water Demand Calculator instead of IPC methodology could save over $58,000 in material and installation costs for traditional copper plumbing.
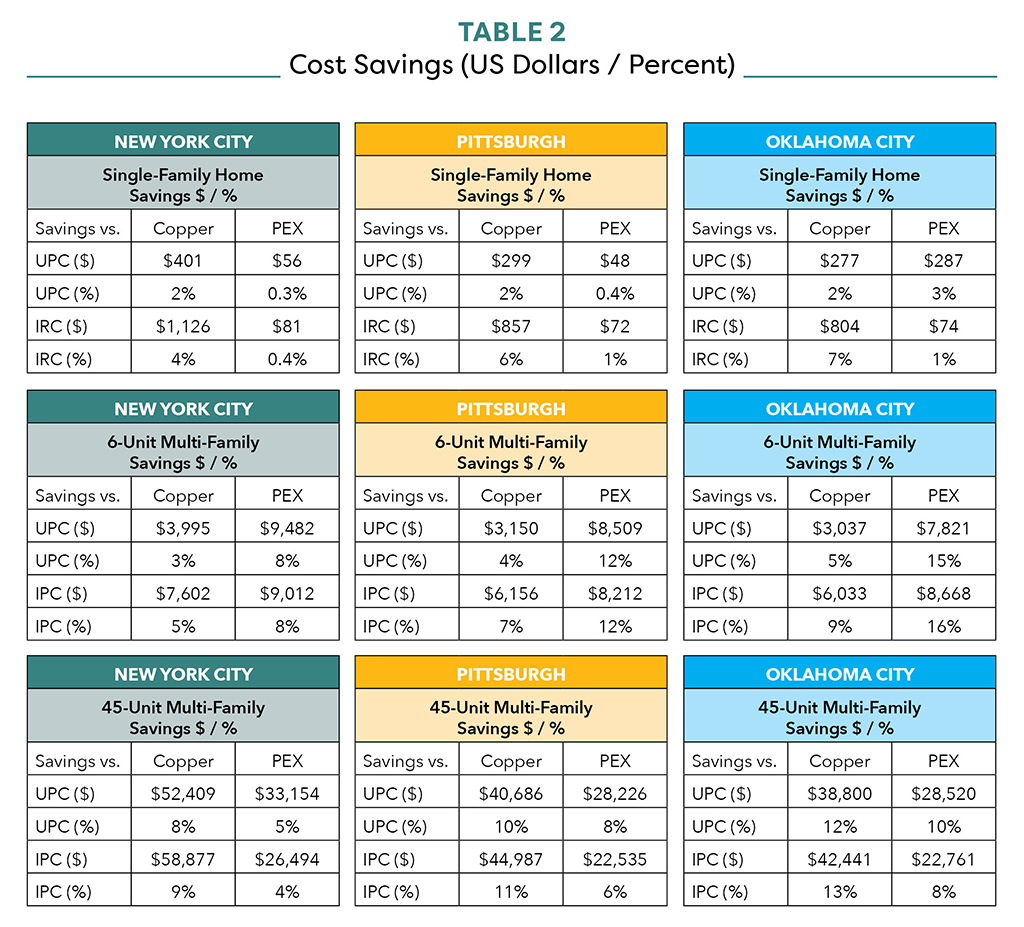
This table shows projected cost savings when using the IAPMO Water Demand Calculator instead of traditional methods offered by UPC and IPC.
Nueva Esperanza: A Case Study in Construction and Utility Savings
The Nueva Esperanza project in Hillsboro, Oregon, offers a compelling example of how affordable housing developers can achieve significant cost and resource savings by using the IAPMO Water Demand Calculator. Completed in 2023, the development consists of 150 units ranging from studios to four-bedroom apartments, distributed across 12 multifamily buildings and one community building. All 13 structures are served by a single domestic water meter, which allowed the design team to optimize the plumbing infrastructure with an innovative approach to sizing.
At the outset, the local water utility provided a quote for System Development Charges (SDCs) based on conventional water use estimates. These default assumptions—typically 225 gallons per day per apartment, with a peaking factor of 1.5—resulted in a recommendation for a four-inch water meter. The associated charge for this infrastructure was nearly $485,000. However, by applying the IAPMO Water Demand Calculator to the design, the development team was able to right-size the water system for actual projected demand based on modern fixture use and real occupancy patterns.
The results were striking. By using the IAPMO Water Demand Calculator, the project team reduced the required meter size from four inches to two inches. This adjustment led to a dramatic decrease in SDCs, saving approximately $400,000. That equates to more than $2,600 in savings per dwelling unit—critical cost relief for an affordable housing project.
Beyond service connection fees, the calculator also helped optimize pipe sizing throughout the development. The use of smaller diameter pipes and fittings translated into direct material savings. For the entire Nueva Esperanza development, this approach saved more than $43,000 solely in pipe materials and fittings. On a per-unit basis, the development saved an estimated $185 in piping costs and $105 in pipe fitting costs.
Resource savings extended well beyond construction. When compared to systems sized using conventional methods, each unit in the Nueva Esperanza project is projected to save 1,106 gallons of water and 2,435 kilowatt-hours of electricity annually. These savings contribute to an avoided greenhouse gas emission of 0.78 metric tons of CO₂ per unit per year. From a financial perspective, this efficiency is expected to yield electricity cost savings of approximately $278 per unit annually, further improving affordability for residents.
The Nueva Esperanza case illustrates how early adoption of the IAPMO Water Demand Calculator enables affordable housing projects to meet performance goals without increasing capital costs. On the contrary, right-sizing based on real usage data results in immediate and long-term savings across multiple metrics—installation costs, utility fees, water use, and energy demand. “This is not just some newfangled sustainability idea that costs more,” Lohr concludes. “This is smarter engineering. It can save money, save resources, and protect people.”
Water Quality, Water Age, and Public Health
The conversation around plumbing system design has long focused on capacity, reliability, and code compliance. But as the public health implications of water distribution systems become better understood, another priority has taken center stage: water quality. At the heart of this issue is a growing awareness of the risks associated with oversized plumbing systems—particularly in multifamily housing and institutional buildings where low-use fixtures, long pipe runs, and intermittent flow are common. Oversizing may appear cautious on paper, but in practice, it often leads to increased water age and decreased flow velocities—conditions that can foster microbial growth and compromise the safety of the water supply.
When pipe networks are oversized, the volume of water sitting in the system increases, and the speed at which that water moves decreases. These lower flow velocities can undermine maintenance of disinfectant residuals and may not effectively clear debris, scale, or microbial buildup from interior pipe surfaces. More importantly, slow-moving or stagnant water creates an ideal environment for opportunistic pathogens such as Legionella pneumophila and Pseudomonas aeruginosa, which thrive in tepid, low-oxygen conditions with minimal flow.
According to the Centers for Disease Control and Prevention (CDC), the number of reported Legionnaires’ disease cases—caused by Legionella pneumophila—has steadily increased. In 2011, approximately 1,000 cases were reported, and by 2020, that number had climbed to 9,933, even amid the COVID-19 pandemic when surveillance efforts were challenged, meaning potential under-counting of cases. This data comes from the CDC’s National Notifiable Diseases Surveillance System (NNDSS), highlighting a more than ninefold increase in less than a decade.8
Legionella has been identified as the primary cause of outbreaks linked to building water systems. A 2021 CDC study reported that approximately 23% of potable water-associated outbreaks were attributed to this pathogen. The disease, which presents as a severe form of pneumonia, carries significant health risks. The CDC estimates that about 10% of individuals who contract Legionnaires’ disease will die. The risk is elevated further in facilities that serve vulnerable populations such as seniors, immunocompromised individuals, or residents of affordable housing, where maintenance resources may be limited. Specifically, the mortality rate increases to approximately 25% in healthcare settings.
Pseudomonas aeruginosa, another opportunistic pathogen found in plumbing systems, is particularly dangerous in hospitals and long-term care facilities. According to the CDC’s 2019 Antibiotic Resistance Threats Report, multidrug-resistant Pseudomonas aeruginosa caused an estimated 32,600 infections and 2,700 deaths in hospitalized patients in the U.S. in 2017 alone. It frequently colonizes biofilms in low-flow or stagnant water systems, making proper plumbing design essential for prevention.9
Right-sizing plumbing systems provides a targeted and effective response to these challenges. By designing pipe networks that match real demand, engineers help ensure that water moves quickly through the system and that the volume stored in distribution lines is minimized. Faster turnover not only reduces water age but also helps maintain flow velocities sufficient to disrupt biofilm formation and support disinfectant efficacy. Importantly, right-sizing allows designers to optimize system performance without depending on expensive secondary treatments, advanced filtration systems, or aggressive flushing protocols that increase operational costs and water waste.
Modern tools such as the IAPMO Water Demand Calculator make this approach practical and have proven especially valuable in affordable housing developments, where infrastructure costs must be controlled, and public health outcomes are closely tied to system performance.
Code Alignment, Sustainability, and the Role of Design Tools
As the construction industry faces growing pressure to support water conservation and climate resilience, the use of more precise sizing methods is gaining momentum. The IAPMO Water Demand Calculator, when paired with WaterSense-labeled fixtures, allows for the opportunity to enhance water efficiency, lower operational costs, and support sustainable design goals.
A more tangible outcome for engineers is that right-sizing supports code compliance and aligns with broader industry guidance. Many modern codes and design standards recognize that legacy approaches like Hunter’s Curve no longer reflect real-world water usage, especially in the context of low-flow fixtures, smaller household sizes, and updated user behaviors. Organizations such as ASPE, the American Water Works Association (AWWA), and IAPMO now actively endorse the use of the IAPMO Water Demand Calculator for residential projects. This professional consensus is a critical signal to code officials, developers, and engineers that right-sizing is not only safe and effective—it is increasingly expected.
While the IAPMO Water Demand Calculator is not yet universally mandated by all plumbing codes, it is rapidly gaining formal recognition in high-performance building regulations and specific market sectors. In California, for example, the Department of Health Care Access and Information (HCAI) and the State Fire Marshal now require listed systems or documented justification when alternate sizing methods are used in health care and high-occupancy residential facilities. These requirements reflect growing awareness that system performance and health outcomes are tightly linked—and that conservative design defaults no longer offer sufficient assurance of safety or efficiency.
Rainwater Harvesting and Right-Sized Plumbing
In Vancouver, British Columbia, the city has taken a bold and proactive approach to water management, especially in response to rapid urban densification and an aging combined sewer infrastructure. Vancouver’s dense development pattern and frequent rainfall create both an opportunity and a challenge. The city’s combined storm-sewer system is often overwhelmed during heavy rain events, resulting in sanitary discharges into nearby water bodies. To address this,
officials focused on capturing rainwater for non-potable uses such as toilet flushing, irrigation, and cooling towers—which alone can account for up to 50% of potable water demand during the summer. This strategy not only reduces potable water use but also eases the burden on stormwater infrastructure during rainfall events.
However, designing these systems correctly is critical. While many mechanical engineers and contractors are familiar with rainwater reuse, poor designs have led to oversized pipes and unnecessary chemical treatments. City officials, in consultation with local health authorities, realized that these large pipes often led to water stagnation, especially in buildings where fixture demand had decreased over time. Because chlorine is typically not added to captured rainwater, it became even more important to reduce water age. That concern led the city to act so, since 2019, all rainwater harvesting and reuse systems in Vancouver must be designed using the IAPMO Water Demand Calculator for pipe sizing, regardless of the specific treatment process. This requirement supports the city’s long-term goals to reduce potable water demand and protect local waterways from sewer overflows.
The impact is already visible. One notable example is the Oakridge Centre redevelopment, set to be completed in 2025. This 28.5-acre project will include 10 residential towers, a community center, park, music venues, a ballet school, office space, and a major retail expansion. It is expected to host the largest non-potable water system in North America, delivering reclaimed rainwater to cooling towers, irrigation systems, toilets, washing machines, and even car washes.
Vancouver’s unique plumbing code has supported this innovation. Unlike the rest of British Columbia, which follows the BC Plumbing Code modeled after the National Plumbing Code of Canada, Vancouver has developed its own hybrid code tailored to urban needs. Mechanical contractors in the city have already begun asking when they’ll be able to use the Water Demand Calculator for potable systems as well, citing clear benefits not just in pipe cost savings but also in freeing up valuable wall space in densely packed buildings.
PROPER SIZED Plumbing for the Win
Right-sizing plumbing systems using the IAPMO Water Demand Calculator represents a meaningful evolution in both technical accuracy and design responsibility. By reflecting actual usage data, rather than outdated assumptions, this method supports the dual imperative of housing affordability and water efficiency. Smaller pipe diameters and meters reduce construction and installation costs, helping developers meet tight budgets without sacrificing performance. In turn, this precision helps preserve space within walls and ceilings—an increasingly valuable commodity in compact multifamily housing projects.
This shift is not simply about economics; it also marks a significant improvement in sustainability. Applying contemporary pipe-sizing methods to multifamily residential systems reduces oversizing, which has long contributed to unnecessary water and energy waste. Accurate calculations allow engineers to better match system capacity to realistic demand, improving operational efficiency and streamlining the use of WaterSense-labeled fixtures, which perform more effectively when supported by consistent pressure and responsive delivery.
Equally important is the relationship between right-sized systems and public health. Oversized pipes increase water residence time, which can lead to stagnation and the proliferation of waterborne pathogens such as Legionella pneumophila and Pseudomonas aeruginosa. Right-sizing addresses this directly by reducing water age and increasing flow velocity—conditions that inhibit bacterial growth and improve overall water quality. These public health benefits are especially crucial in settings that serve vulnerable populations, including affordable housing, healthcare facilities, and aging-in-place communities.
Finally, right-sized systems enhance user comfort and reduce structural water waste. More efficient hot water delivery means occupants wait less time for warm water at taps and showers, which reduces daily water loss and increases satisfaction with system performance. This practical benefit, paired with improved fixture performance, reflects a holistic approach to water management that meets today’s expectations for conservation, resilience, and accountability.
The IAPMO Water Demand Calculator doesn’t just modernize how we size plumbing—it redefines how we balance performance with responsibility. In doing so, it empowers engineers, designers, code officials, and developers to create buildings that are smarter, safer, and better prepared for the challenges ahead.
Andrew A. Hunt is the Vice President of Confluence Communications, specializing in the writing, design, and production of articles and presentations related to sustainable design in the built environment. In addition to instructional design, writing, and project management, Andrew is an accomplished musician and voice-over actor, providing score and narration for both the entertainment and education arenas.
End Notes
- https://iapmo.org/media/lvooslfg/iapmo_energy_savings_arup_report.pdf
- https://iapmo.org/media/valfp1bw/awe-meter-size-connection-fee-research.pdf
- https://localenergycodes.com/download/1461/file_path/fieldList/2024+CPC+Appx+M-Alternative+Calc+Water+Demand.pdf
- https://iapmo.org/research/whitepapers-and-studies/peak-water-demand-study-executive-summary
- https://iapmo.org/research/whitepapers-and-studies/peak-water-demand-full-studyfact-sheet_wdc.pdf
- https://iapmo.org/research/whitepapers-and-studies/stantec-cost-report
- https://www.cdc.gov/legionella/php/surveillance/index.html
- https://www.cdc.gov/antimicrobial-resistance/data-research/threats/index.html