A Guide for Specifying Commercial Lighting


The distribution curve also reveals if the fixture distributes light in a focused spotlight pattern or a wider flood pattern. A fixture with a focused or spot distribution will have a relatively narrow distribution curve with light remaining either above or below the light source in the center of the graph, whereas a medium or wide floodlight will have an increasingly wider distribution pattern.
The shape of the distribution pattern can communicate differences in how the different fixtures will perform in the space. When comparing fixtures that emit light in a batwing pattern and fixtures that emit light in a spherical pattern, the batwing pattern provides a relatively wider distribution of light and blankets a working plane with fairly even levels of illumination. Spherical patterns can create less even illumination, and in some cases even lighting deficiencies, at the working plane.
Performance issues that a fixture may have, such as disruptions in the distribution pattern or a propensity to create glare, can also be deduced by reviewing the distribution curve. A smooth and rounded candela distribution curve indicates that the light fixture will produce a smooth light pattern, whereas striations in the distribution pattern indicate that the fixture may cause inconsistent illumination and streaking in the space. The candela distribution curve can also reveal if a fixture is likely to produce glare. Fixtures that emit high-intensity light (300+ candelas) in the vertical viewing angle range of 65 to 90 degrees are considered at higher risk for creating glare in a space.
It is important to note that each candela chart and candela distribution curve is generated to reflect the performance of a specific fixture and lamp combination. Making changes to the lamp, fixture, or aspects of the fixture can materially alter the candela chart and candela distribution curve of the fixture.
The data found on a candela chart can be entered into lighting design software for a more detailed analysis of the distribution pattern and to identify potential performance issues. Many manufacturers make this information readily available for their specification-grade fixtures. These files are typically produced in the standard format created by the Illuminating Engineering Society (IES) and are often referred to as IES files.
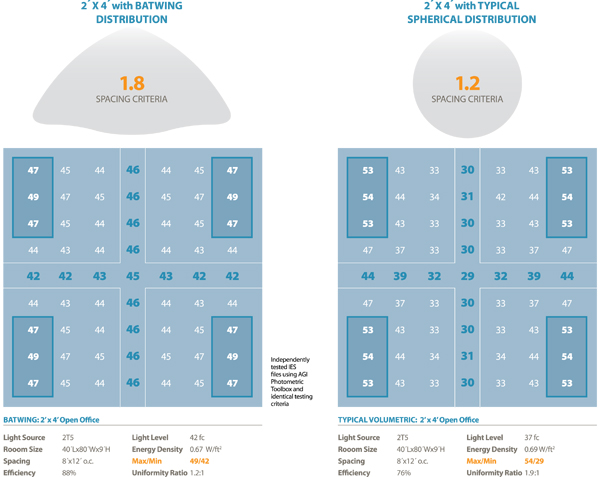 |
A fixture that distributes light in a batwing pattern can spread light more evenly at the work surface than a fixture that distributes light in a more spherical pattern. Image courtesy of Prudential Lighting |
Energy Efficiency and Good Commercial Lighting
Commercial lighting consumes a lot of energy. In fact, the Buildings Energy Data Book, published by the United States Department of Energy concluded that, in 2010, lighting was the largest energy consumer in commercial buildings, consuming over 20 percent of the 18.26 quadrillion Btu used by commercial buildings in the United States that year. That is more than any other recorded end-use, including: heating, cooling, ventilation and refrigeration.
In an attempt to limit the growth of the largest energy consumer in the commercial environment, building energy codes specifically address the amount of energy that a lighting system can consume in a commercial building. Designs must satisfy energy codes as a condition for approval to construct and occupy buildings in the United States.
The building energy standard written by the American Society of Heating, Refrigerating and Air-Conditioning Engineers (ASHRAE), referred to as the ASHRAE 90.1 standard (ASHRAE 90.1), is one standard with which compliance is mandatory. ASHRAE 90.1 limits the amount of lighting power that can be used in a commercial building by defining an allowable amount of installed lighting power (in watts) per area of floor space (in square feet). This W/f2 metric is referred to as the lighting power density (LPD).
Allowable LPD varies by building and space type. For example, in ASHRAE 90.1-2010, office buildings are allowed 0.9 W/f2, schools are allowed 0.99 W/f2, and a museum is allowed 1.06 W/f2.
Notice