Designing for High Winds


Using Wind Speed Maps
Mapped wind speed contour lines delineate wind speed increments of either 5 mph or 10 mph and are not intended to represent a zone's fixed wind speed. Linear interpolation of wind speed between contour lines is permitted. For example, a building situated halfway between the 120 mph and 130 mph contours could be designed for a wind speed of 125 mph based on linear interpolation. Alternatively, a design wind speed of 130 mph6 could conservatively be used.
Wind Loads on Buildings
Buildings and structures are designed and constructed to resist wind loads, i.e., wind pressure, as opposed to wind speeds. Wind speed, although a significant contributor, is only one of several factors that affect wind loads acting on a building that must be considered in proper design. Factors that affect the calculated design wind loads (pounds per square foot, or psf) include:
▶ Combined gust factor and external pressure coefficients (GCpf) for low rise buildings
▶ Combined gust factor and internal pressure coefficients (GCpi)
▶ Design velocity pressure
Design velocity pressure varies based on the following factors:
▶ Mapped wind speed (which can vary by risk category for a given location)
▶ Exposure category
▶ Topographic effects
▶ Wind directionality
▶ Elevation factor
In addition, wind loads may vary based on the building's response characteristics. Provisions of IBC Section 1609 apply only to structures of shapes that do not have unusual response characteristics and which are located on sites that are not subject to channeling effects or buffeting in the wake of upwind obstructions. Channeling, for example, would occur when wind speeds are magnified due to the venturi effect as they are directed between tall buildings, thus subjecting downwind structures to higher wind speeds. Should unusual circumstances exist, the design wind loading must be determined by wind tunnel tests or nationally recognized data.
As an example of design velocity pressures for specific building locations and risk categories, consider the tables on page 4. All locations identified are within the hurricane-prone region with the exception of Dallas, Texas. As can be seen, for a given location, design velocity pressure in accordance with Equation 1 varies by risk category and exposure category (see Figure below). For example, for Exposure C in West Palm Beach, Fla., a Risk Category II building has a design wind speed of 170 mph while Risk Category III buildings have a design wind speed of 182 mph and Risk Category IV buildings have a design wind speed of 190 mph. Further, design velocity pressures vary for the same risk category when the exposure category changes. And, as can be seen, design velocity pressures for buildings subject to Exposure D are noticeably higher than for Exposure C.
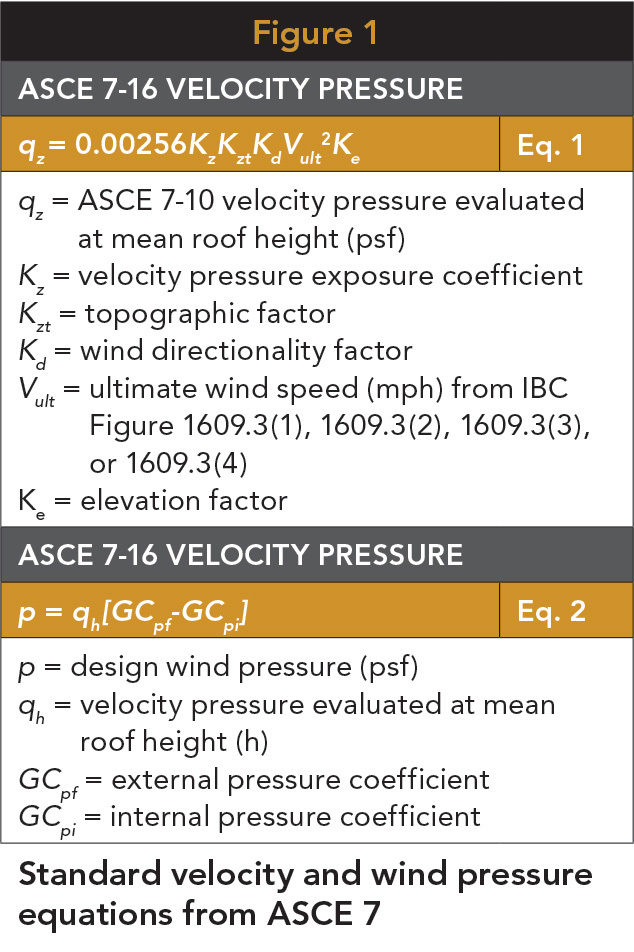
Standard velocity and wind pressure equations from ASCE 7
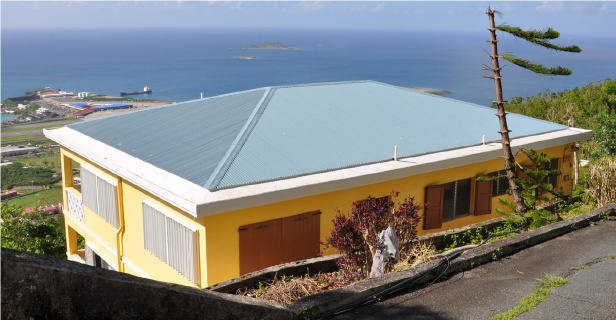
Photo: FEMA 488, Mitigation Assessment Team Report, Hurricane Charley in Florida
After Hurricane Charley, FEMA noted no structural damage to new wood-frame buildings built to the 2001 Florida Building Code standards.
Notice