Site Lighting: Optical Systems Design and Application Guide for Site and Roadways


II. PHOTOMETRY INFORMATION
The design of site lighting requires an understanding of the unique information used to represent elements of optical performance. Photometry, or the measurement of light intensity and relative illuminating power, is the foundation on which any evaluation of luminaire performance is based. Use of independent testing labs to conduct the measurements and compile the information ensures that the photometry information is accurate and reliable.
Basic Language and Presentation
In order to properly select luminaires appropriate to the
specific locations and requirements of a building site, an
understanding of some of the basic language and ways that
information is presented is required.
|
|||
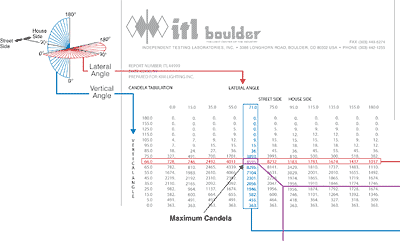
Candela Tabulation
One of the fundamental units of measurement is the candela,
which in 1979 became the international standard to define
luminous intensity. Figure 2 shows a typical candela tabulation
data sheet prepared by an independent lab with a luminaire
orientation diagram for reference.
The Candela Tabulation Data Sheet presents the raw data used for all illuminance calculations and is tabulated with the vertical angles in rows and lateral angles in columns. As the diagram indicates, lateral values from 0° to 90° are in front of the luminaire and referenced as "Street Side." Lateral values from 90° to 180° are behind the luminaire and referenced as "House Side."
Vertical values from 0° to 90° are below the fixture, while values 90° to 180° are at the fixture level and above. As we will see, candela data is also used to define a luminaire's light distribution type and cutoff characteristics.
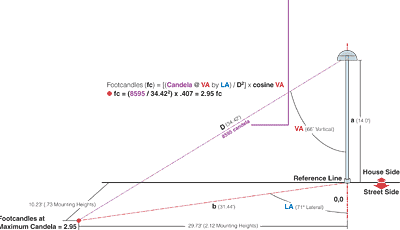
Footcandle Calculations
The data provided in Candela Tabulation Data Sheets is used
to calculate footcandle levels within a proposed lighting
design. Generally, this is accomplished by using computers
to make calculations, which are, in turn, dependent upon the
accuracy of the data. Figure 3 illustrates the relationship
of the calculated illumination at a single point to the information
provided in the candela tabulation. (See Figure 7 later in
this article for the correlating location on an isofootcandle
plot.)
|
|||
Notice