Projection Screens Made Simple


Contrast
Contrast affects how well a viewer can “read” the image. Low contrast reduces image detail and resolution, high contrast increases detail and resolution. Image contrast is even more critical when the application involves high resolutions graphics, medical imaging, control rooms, and CAD applications.
System contrast is an average of measurements of black at different locations on the screen compared to white at different locations on the screen measured in the existing lighting conditions of the application. Ambient light will affect the measurement of black. When measuring system contrast an ANSI checkerboard pattern is used.
The potential brightness of an image can actually be calculated. Brightness is measured in foot lamberts. The basic formula for ft lamberts is ft lamberts = screen gain x lumens / sq ft of image. While this formula measures how bright the image could be, it does not provide information on how well the image will appear. There can be two systems in the same lighting producing the same amount of brightness, but the contrast could be very different between the two if they have different screen surfaces. However, calculating the system contrast ratio will provide specifiers with an idea of the quality of the image in the application in question. Several calculators can provide this information, based on the following parameters.
• Content/Use of the system
• Image Size
• Projector Brightness
• Throw Distance (or Lens Ratio)
• Light level at the screen
• Light Level at the viewer
 |
An ANSI checkerboard pattern is used to determine contrast. Image courtesy of Draper Inc. |
Standards now exist that list the minimum recommended system contrast ratio standards for four different viewing categories. According to ANSI/INFOCOMM 3M-2011, a standard that provides metrics for measurement and requirements for minimum contrast ratios for rear and front projection audiovisual projected image systems, the four viewing categories are:
• Passive viewing. The viewer is able to recognize what the images are on a screen and can separate the text or the main image from the background under typical lighting for the viewing environment. The content does not require assimilation and retention of detail, but the general intent is understood. There is passive engagement with the content, that is, non-critical or informal viewing of video and data.
• Basic decision making. This category essentially applies to presentations. The viewer can make basic decisions from the displayed image. The decisions are not dependent on critical details within the image, but there is assimilation and retention of information. The viewer is actively engaged with the content, such as information displays, presentations containing detailed images, classrooms, boardrooms, multi-purpose rooms, and product illustrations.
• Analytical decision making. More critical viewing of detailed content such as spreadsheets, control room data, and CAD, are required in this category. The viewer can make critical decisions by the ability to analyze details within the displayed image. The viewer is analytical and fully engaged with these details of the content, which can also include medical imaging, architectural/engineering drawings, forensic evidence, or photographic image inspection.
• Full motion video. This type of viewing refers to high-definition content such as is found in home theaters, business screening rooms, and broadcast post-production facilities. The viewer is able to discern key elements present in the full motion video, including detail provided by the cinematographer or videographer necessary to support the story line and intent.
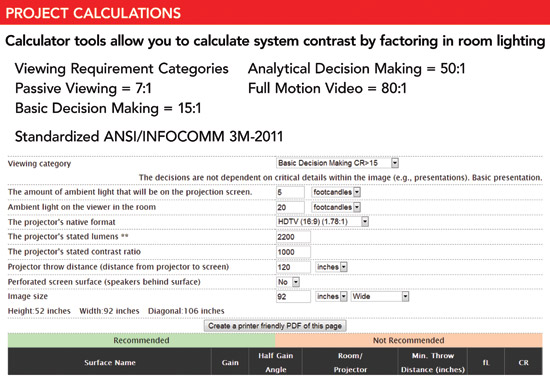
The accompanying diagram is an example of a calculator available to systems designers for calculating the brightness and contrast of a system using various screen surfaces. These standards provide the minimum targets for each application category that designers should try to meet or exceed for optimal viewing. For an application with a mix of content, a value that is in the middle of the categories should be used as a minimum.
System Calculators
Because matching up screen surface capabilities with room conditions and other variables can be a complicated process, manufacturers have introduced web-based tools to simplify the process. Screen surface selectors take into account factors such as projector brightness, light on the screen, projector location, specs and more to narrow screen surface choices to “good,” “better” and “best” and to select the correct projector lumen output and the proper projector focal length to meet project applications. Many calculators also configure theoretical ANSI checkerboard contrast ratios utilizing different screen materials for any ambient room light scenarios.
 |
|
Image courtesy of Draper Inc. |
Notice