Life Cycle Assessment of Building Products


The significance of this action between now and 2030 cannot be understated. Roughly speaking, through the overall lifetime of an entire building it is the building operations that will account for approximately 75 percent of energy use and carbon footprint, leaving about 25 percent embodied in the products. However, if you look at the same building in the near term, the energy and corresponding carbon footprint embodied in the building materials is a much higher ratio. This comes from the simple observation that all of the CO2 emissions embodied in products have already been released prior to the building ever being operational, and it can take years for the emissions from operations (i.e., energy use) to catch up. In fact, the typical building can operate on the order of 15 or 20 years before its operations match the amount of embodied carbon in the products that went into it. So, a building constructed in 2010 could find in the year 2030 that its total carbon footprint up to that point in its life is made up of only 55 percent from operations while a whopping 45 percent is still attributed to the products. Hence, there is a dramatic need to reduce the carbon footprint not only of the buildings, but the products as well.
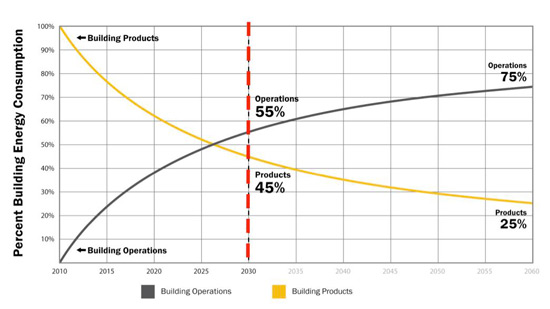 |
While building operations account for most of the carbon footprint of a building after 50 years, it can take 15 to 20 years before those operations match the amount of carbon embodied in the building products. Chart courtesy of Architecture 2030 |
Certification Example
To help illustrate how a building product can interface with these different certifications using a life cycle assessment and EPD report, let's look again at the example of the life cycle of fly ash brick. Following the appropriate PCR the typical sequence of its life cycle and inherent assumptions looks something like this:
- Cradle: Extraction and transportation of raw materials includes quarrying of sand and reclamation of fly ash plus transportation of both to the manufacturing site.
- Manufacturing/gate: Material processed using reduced amounts of energy compared to conventional clay masonry; finished material ready to be loaded onto trucks for delivery to job.
- Construction/jobsite: Transportation to jobsite; installation at building, including the mortar needed to install the bricks.
- Building Use: Service life of brick in building, including tuck-pointing the mortar once.
- End-of-life: Building demolition and recycling of some amount of material.
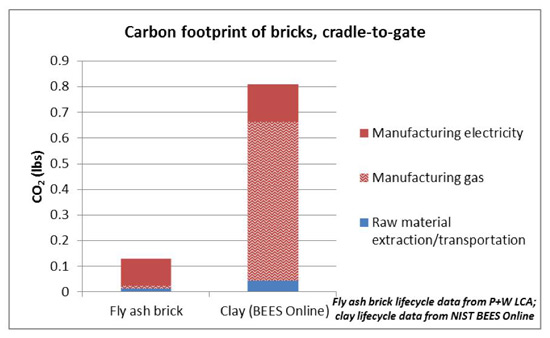
The impact table that results from the LCA and is reported in the EPD will show the specifics of the environmental impacts of this product through all phases of its life cycle. If a comparison were to be made just on the cradle-to-gate phases against clay masonry, then the corresponding values could be compared and assessed to determine which product held less embodied energy and had a smaller carbon footprint. The product in our example also qualifies for SMaRT certification, so it would contribute to the following certifications:
- LEED — MR points would be earned based on the results of an ISO-compliant LCA that was carried out and the third-party-verified EPD. It would also contribute to an ID point for SMaRT products.
- Architecture 2030 — The EPD results show an 84 percent reduction in carbon footprint, compared to conventional clay brick. This means that it meets the Architecture 2030 Product Challenge goal, not just for the current year (35 percent reduction by 2015), but it already exceeds the goal for 2030 (50 percent or better reduction in carbon footprint).
- SMaRT — In our example, the fly ash brick achieves very high marks under the SMaRT program earning Sustainable Platinum certification.
 |
 |
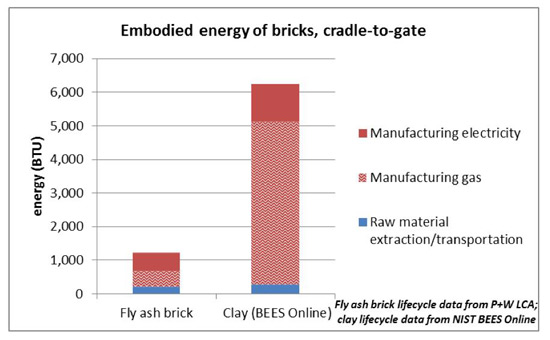 |
A comparison of both the embodied energy and carbon footprint of fly ash brick compared to clay brick. Note that the fly ash brick information is based on an EPD while the clay brick information is based on generic BEES Online data but shows a significant difference in environmental impacts in both cases. Charts and image courtesy of CalStar Products |
This is just one example of course, but it shows how the use of LCAs and EPDs can help identify the true nature of different products, make their comparison much more direct, and contribute directly to green building certifications.
Notice