Selecting the Right Architectural Lighting Fixture for Any Project Space


Predicting the Performance of a Fixture in a Space Using Photometric Test Reports
It is not enough to approve a fixture for a project based on fixture appearance, craftsmanship, mounting type, and cost. Design teams also want to know, “How will this fixture perform in the actual project space?” Unfortunately, most projects lack the budget and timeline to create a full-scale mock-up that would prove the fixture capable or incapable of meeting the design goals before installation. Luckily, specifiers can use photometric reports to predict how a lighting fixture will perform in a specific application.
Photometric reports describe how a fixture distributes light, how efficiently it is distributed, and how likely it is to produce glare or unwanted patterns. A comprehensive photometric report contains a lot of information. Two of the most important items to review in order to assess the distribution pattern of a particular fixture are the candela chart and the candela distribution curve.
The Candela Chart
The candela chart displays the relative light intensities (measured in candelas) of a fixture at various vertical and horizontal viewing angles. To first describe a vertical and horizontal viewing angle, imagine a hanging, 2-by-4 linear direct/indirect troffer fixture. The vertical axis of the troffer is an imaginary line that runs through the center of the fixture from a point directly beneath the fixture on the ground (0 degrees) up to a point on the ceiling directly above the fixture (180 degrees). The horizontal axis runs through the center of the fixture from end to end (90 degrees to 270 degrees). A person standing at one end of the fixture (90 degrees) could measure the intensity of the light at various points along the vertical axis (0 to 180 degrees) called vertical viewing angles and gather all of the light intensity values for that one vertical plane of the fixture from that one specific horizontal viewing angle (90 degrees).
If the fixture emitted a perfectly symmetrical pattern of light in all directions, the entire lighting distribution pattern could be detailed from this one group of measurements. However, most fixtures do not emit a symmetrical pattern of light in all directions, so more measurements need to be taken. The candela chart displays the lighting intensity measurements taken for entire vertical planes (0-180 degrees) at various horizontal viewing angles (0, 22.5, 45, 67.5, and 90 degrees) around the fixture. The candela chart displays the horizontal viewing angles across the top as the column headings and the vertical viewing angles (increments between 0 and 180 degrees) as the row headings.
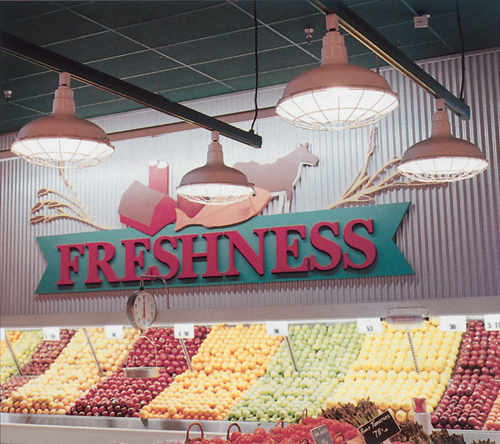 |
Specifiers may use photometric reports to predict how a fixture will perform in a space. Photo courtesy of Bock Lighting |
 |
This is the candela chart for the lighting fixture pictured above and it illustrates the way that the fixture distributes light. |
Here is an example of the candela chart for an architectural fixture with a reflector lamp. The candela chart is the table in the center with the column headings: Ang., CP, and Lum. The vertical viewing angles (0-180 degrees) are found along the right-side column and the associated light intensities (in candela) are under the middle column header CP, which stands for candela power. The candela chart illustrates that this particular fixture is a direct fixture only emitting light below the 90 degree angle and emitting zero candelas at 90 degrees and above. The light intensity at zero degree (a spot directly below the fixture) is 1026 candelas and is the viewing angle with the greatest lighting intensity. At the 25 degree viewing angle, the fixture emits a light intensity of 930 candelas and at the 55 degree viewing angle, 620 candelas are measured.
Notice