Spreadsheet Sustainability


A Spreadsheet Approach
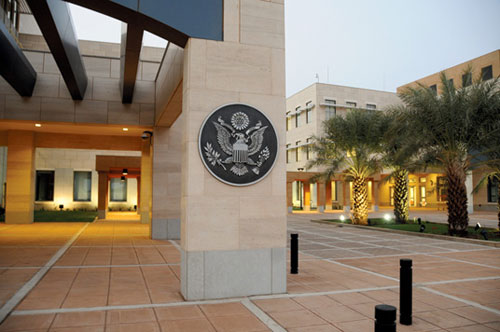
CTG engineers have applied their Sustainable Communities Model to a diverse range of projects, including new city plans and even the design of a new U.S. embassy in Juba, Sudan. The embassy, designed by Einhorn Yaffee Prescott and currently in construction, is targeting LEED certification and illustrates the potential for multi-criteria modeling. Before modeling begins, the first step in most projects is gathering data: annual climate files, square footage of the building organized by space type, acres of landscape, parking spaces, transport trip forecasts, census data, energy- performance data for given building types, and anything else available. "The bulk of the work is getting good data," Meacham says.
For a domestic project, CTG can often rely on historical data provided by local planning departments, filling in gaps with assumptions or information from readily available national and state databases such as the Commercial Buildings Energy Consumption Survey (CBECS) or the California Commercial End-Use Survey (CEUS). They did not have this breadth of information available for their site in Sudan, so they used assumptions and experience from similar projects. All of this information feeds baseline assumptions, or a business-as-usual case from which to measure improvements.
CTG's engineers can then start at the community or building scale to balance sometimes-competing issues like energy and water consumption, greenhouse gas emissions, air pollution, water quality, transport and parking, landscape design, and renewable energy systems. The results are reported in environmental and economic returns with a cost-benefit analysis, and usually illustrated with Sankey diagrams that show the supply and demand for each source. For the Sudanese embassy, Meacham and his colleagues found the approach especially useful when analyzing the self-sufficient water systems that included supply from an on-site water-processing plant and sewage-treatment systems for the embassy's multiple buildings.
 Click on image to see more details 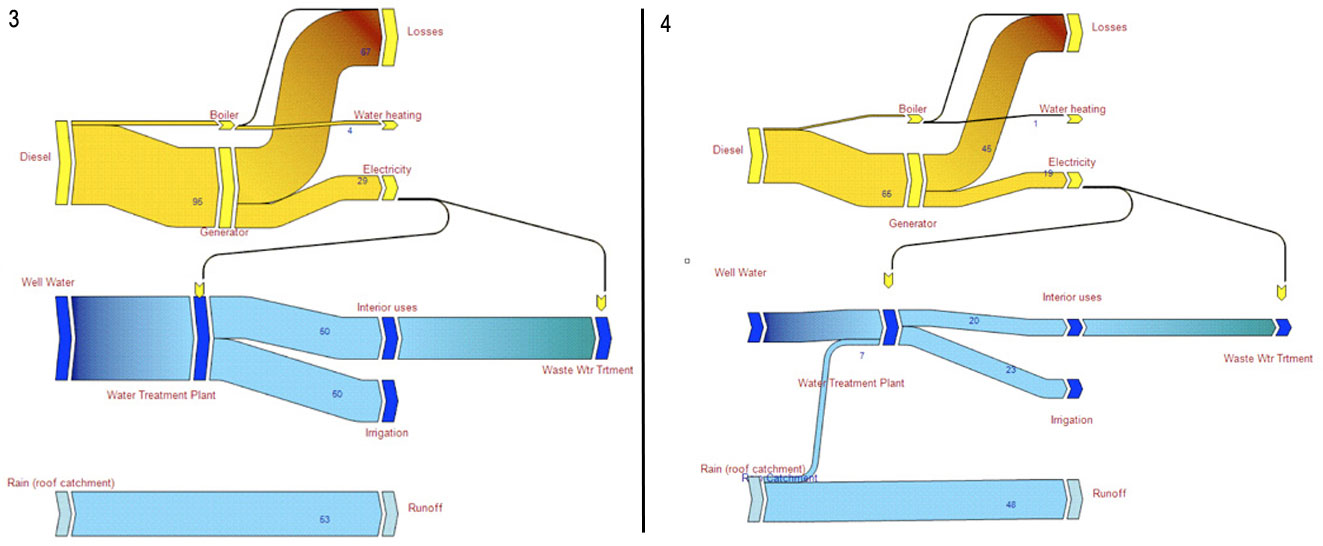 |
For the U.S. embassy in Sudan, CTG Energetics used Sankey diagrams comparing baseline design (3) to the optimized scenario (4), showing the combined energy and water savings. Images: Top, Teri Shikany; 3,4 courtesy CTG Energetics |
Notice