Off the Map


Planning for Climate Change
Modeling climate change is something that certainly requires immense computing power. Esri’s work in Japan mapped coastal flooding based on a recorded event, but most efforts with respect to coastal risks and resiliency are projections of the potential of global climate change to affect sea levels.
In the last several years, nearly every major coastal city in the world has produced inundation maps using a GIS platform. These are often based on climate models developed by the United Nations’ Intergovernmental Panel on Climate Change (IPCC). In a 2000 report, the IPCC established no fewer than 40 emissions scenarios that describe a range of possible future outcomes. These projections take into account demographics, economics, and technology and have been further developed into climate models by a number of organizations, such as NASA. Relying on historical weather data to establish boundary conditions, these groups have modeled in 15-minute increments potential global weather patterns (temperatures, cloud formation, and ocean circulation, to name the most common) well toward the end of the century. These huge data sets can then be mined to develop more locally specific projections of climate change effects, such as increased rainfall or more extreme summer temperatures.
| NREL – Renewable Energy Map, United States |
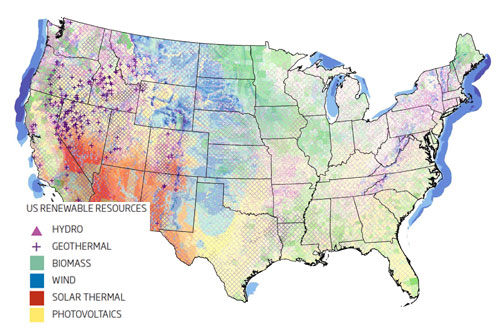 |
Identifying Energy Opportunities Image courtesy of NREL |
Researchers at the Oak Ridge National Laboratory in Oak Ridge, Tennessee, use such models to produce GIS-based maps to visualize the consequences of climate change and other natural phenomena to help federal, state, and local government agencies plan for recovery efforts from catastrophic events. Budhendra Bhaduri is head of the Geographic Information Science and Technology Group at Oak Ridge, which produces the LandScan global population map, considered the highest resolution population data set available. Based in an ArcGIS platform, the LandScan map divides the world into 1-km-by-1 km cells. With such detailed data sets, Bhaduri’s team has written proprietary algorithms that can simulate the movement of people in response to occurrences like hurricanes or floods. Such analysis can yield insights into how roads, the electrical grid, or the food supply might fall short when populations are displaced. “Once you have a large group moving to another area, you have to accommodate its needs, acccounting for a stressed-out infrastructure,” says Bhaduri, who considers the visual representation of such migrations one of the key strengths of GIS.
Layering the City
While GIS pervades municipal planning offices and all levels of government, its roles in professional design practice have been largely limited to planning, landscape architecture, and the engineering-rooted disciplines that support infrastructure projects. GIS lacks mention in several recent books, perhaps most curiously in Ecological Urbanism, the 655-page doorstop produced by the Harvard University Graduate School of Design in 2010, which purports to set a new agenda for urban planning. Such omissions suggest that while GIS may be increasingly used and on display, very few architects are explicitly thinking through the new opportunities presented by the infinite amounts of public data now available through Internet resources. However, a few architecture firms are tentatively starting to implement its use.
| Adrian Smith + Gordon Gill Architecture – Urban Planning Maps, Chengdu, China |
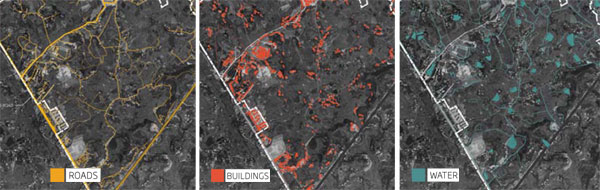 |
Urban Site Analysis Images courtesy of Adrian Smith + Gordon Gill Architecture |
Peter Kindel is an urban designer at Chicago-based Adrian Smith + Gordon Gill Architecture, leading the urban design of a new city proposed for 100,000 people on an approximately 250-acre site outside Chengdu, China. Here, his team employed GIS analysis to identify landscape features and understand the potential for enhancing the natural drainage systems on the greenfield site. “More cities, especially in China, are using GIS as their basic platform for urban planning, so we could build up a series of analytical drawings of watersheds, vegetation, roads, existing structures, land form, and tree cover fairly easily,” says Kindel. After their site analysis using GIS, Kindel and his colleagues shifted to working in Rhino to develop the urban model. So far, the architects have not been able to integrate their architectural process in Rhino with a GIS platform, but they do see that as the next step. “We used over 17 software programs to design this city, so our designers need an incredible amount of knowledge of these different programs,” Kindel says. “Switching between them takes time.”
Notice